Viewing the solution on the map
You can open a solution on the map and share it. To open the solution on the map, use one of the following methods:
On the page with the resulting solution, click Export → Copy link to MVRP map.
A link in https://yandex.com/courier/mvrp-map/#calendar/shared-<task_id> format is valid for 30 days from the receipt of the solution.
You can view the solution without logging in to the service.
https://yandex.com/courier/mvrp-map/#calendar/<task_id>
In the example above, task_id is the solution ID. You need to log in to the service to view the solution.
-
Go to
https://courier.yandex.com/vrs/api/v1/result/<task_id>, wheretask_idis the solution ID. -
Save the resulting JSON to a file.
-
Go to
https://yandex.com/courier/mvrp-map/#calendar/json. -
Click Upload JSON in the upper-right corner and select the saved file.
You need to log in to the service to view the solution.
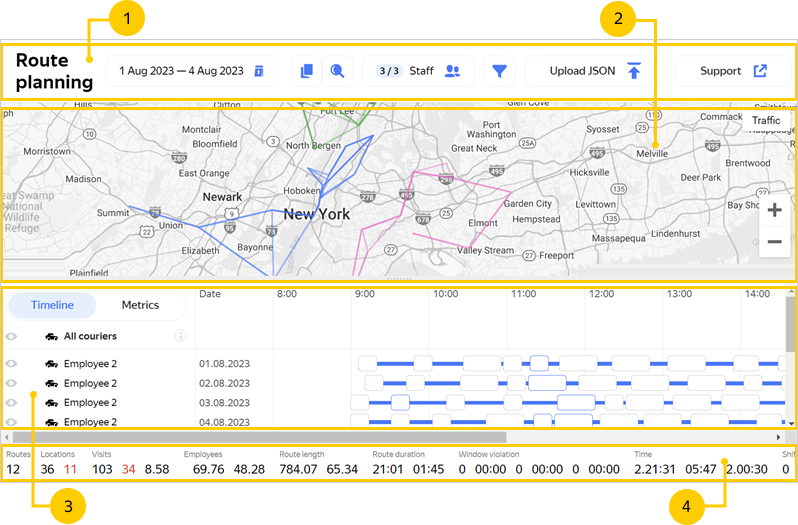
Page elements
The solution page contains:
- Control panel: Solution actions and control buttons.
- Map: A geographical representation of the routes and unassigned visits.
- Routes: Timeline and solution metrics.
- Solution statistics: Final indicators.
All violations are highlighted in red.
Control panel
- Date
-
Corresponds to the date or period for which the solution was planned. By default, routes are displayed as of the date that corresponds to the start of the planning period. To view routes for multiple days in a row, enter the start and end dates. You can select only the dates within the planning period.
- Copy the planning link
-
Use the icon to copy the link to a ready solution.
- Search
-
Search by location or route number. To go to a particular object, select a location or route from the drop-down list, and it will be highlighted in the blocks.
- Employees
-
You can hide routes from specific employees.
-
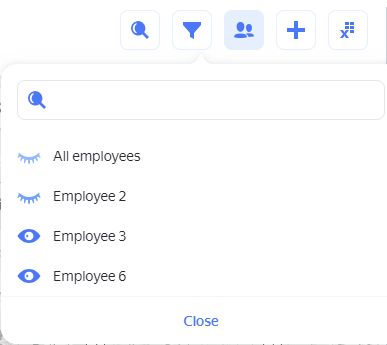
- Filter
-
The filter lists the values from the Employee properties field in the Routes table (equivalent to tags). To display routes that match specific employee properties, select the appropriate value. You can select multiple values. As a result, data is filtered across all blocks.
- Upload JSON
-
You can upload a ready solution in JSON format to have it displayed on the map.
- Support
-
A button for contacting support.
Map
The map shows the geographical location of routes.
Hovering over a location brings up a card with information about it.
Routes
There are two display modes: Timeline (default) and Metrics.
To view the result with the parameters from the API response, click  . The Task Information pop-up window contains the values of the key solution metrics and options.
Timeline
In this mode, routes are presented as a Gantt chart. The size of the stop elements is proportional to the estimated time the employee will spend at the corresponding location.
To display a specific route on the map, select it from the route list. Use and at the beginning of the row to hide and show routes on the map.
Hovering over a location brings up a card with information about it.
Metrics
The metrics table shows the values of key parameters of the routes you've built.
Hovering over the employee ID in the first column of the table shows the total route cost. To sort the data in the metrics table by column, click the column header (once or twice depending on the preferred sorting order).
Solution statistics
At the bottom of the page, you can see the total and average indicators for the solution. Hovering over an indicator shows a tooltip with its description.