New Report Wizard
The new Report Wizard is a statistics tool that lets you analyze your campaigns' performance and access detailed information about their metrics.
Key features:
-
Reports load faster.
-
Quick and simple navigation through dimensions and metrics.
-
Dimensions and metrics can be preconfigured.
-
Customize your reports using quick actions — sort rows, move columns, and delete columns right inside the reports.
How to analyze ad performance if you're new to the Report Wizard
Besides the new Report Wizard, Yandex Direct offers various analytics tools that can be used by both experts and beginners. Among the key tools are the report library and AI assistant.
Report library
The report library is a collection of preconfigured reports for various analytics tasks and campaign types. These reports let you quickly assess the results of your performance and reach campaigns, as well as view statistics for specific areas such as search queries, platforms, or sales performance. You can also build custom reports based on the library reports.
Learn more about the report library
AI assistant
The AI assistant builds reports based on your prompts, so you don't have to manually configure dimensions, metrics, filters, and other settings. You can describe your task in your own words or choose from suggestions.

To chat with the AI assistant, go to your Yandex Direct account and click ![]() in the bottom-right corner.
in the bottom-right corner.
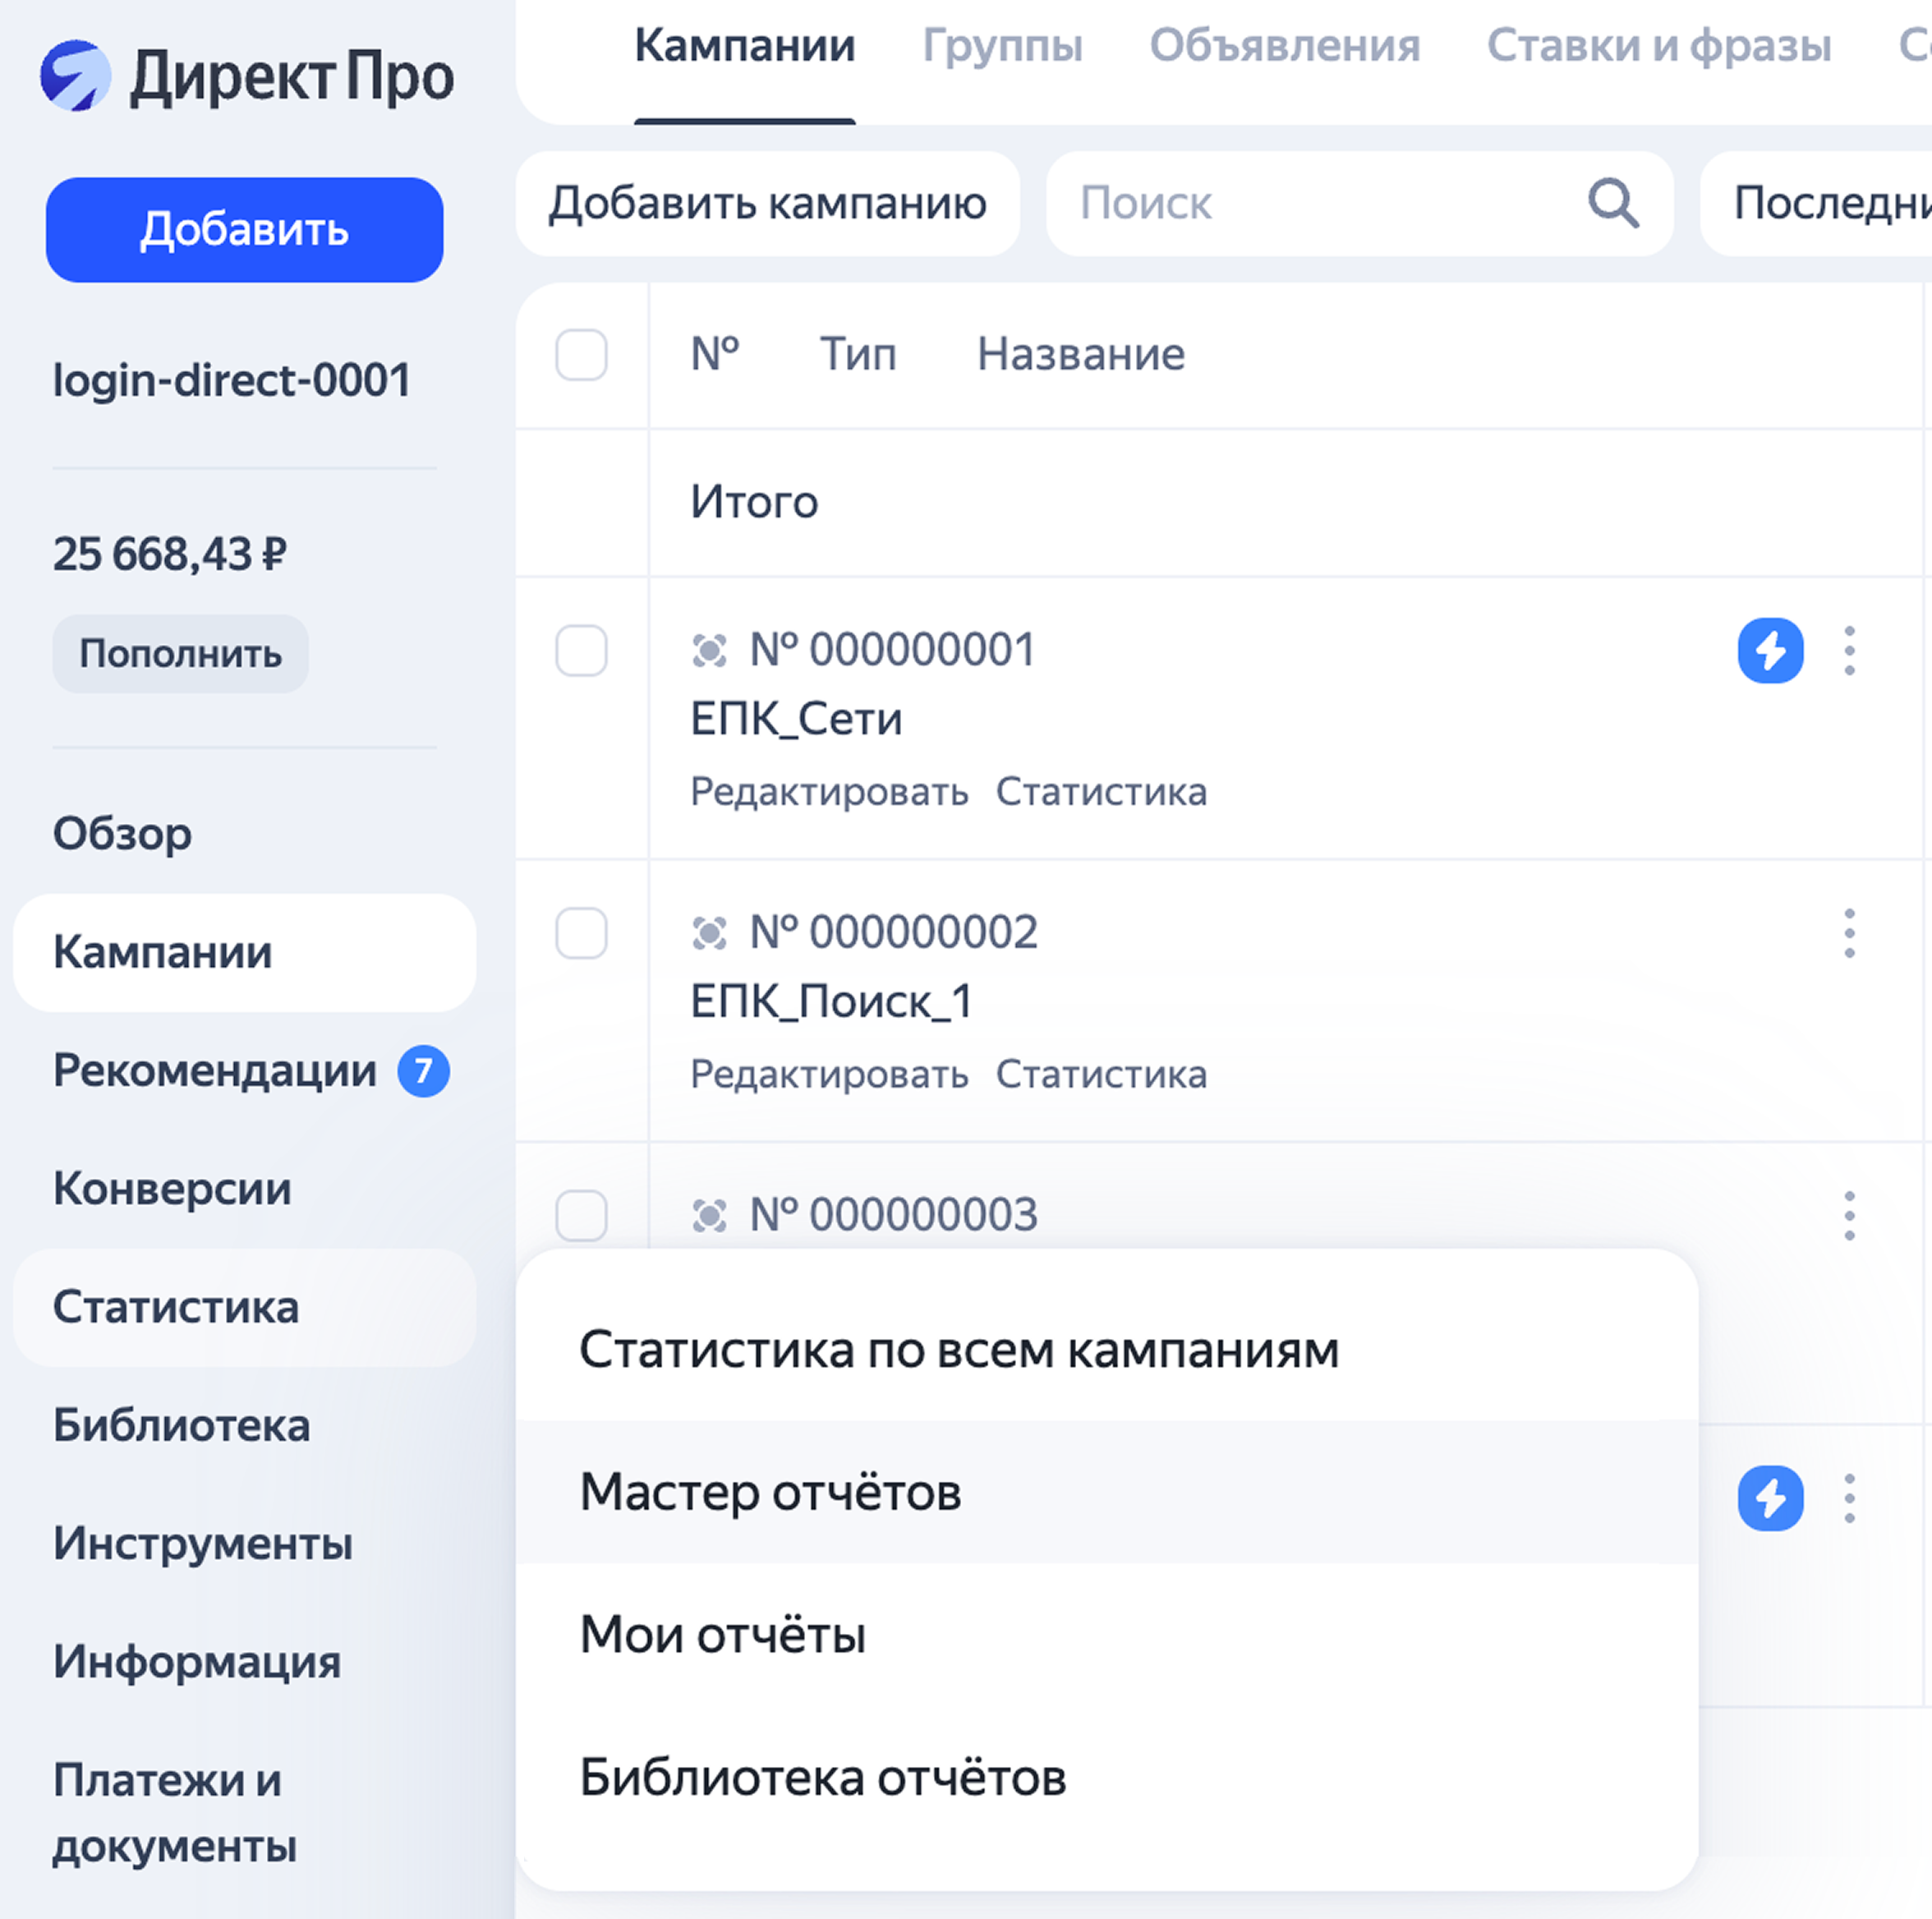
How to open the new Report Wizard
You can access the new Report Wizard in several ways: from the navigation menu, the campaign list, or campaign edit page.
Navigation menu in Yandex Direct
From the Yandex Direct menu, select Statistics → New Report Wizard.
Campaign list
You can go to statistics from the campaign list. This opens a library report that matches the campaign type: performance campaign, reach campaign, app promotion campaign, or other type.
To access a report from the campaign list:
-
Click
 next to the campaign and select Statistics (New) from the drop-down list.
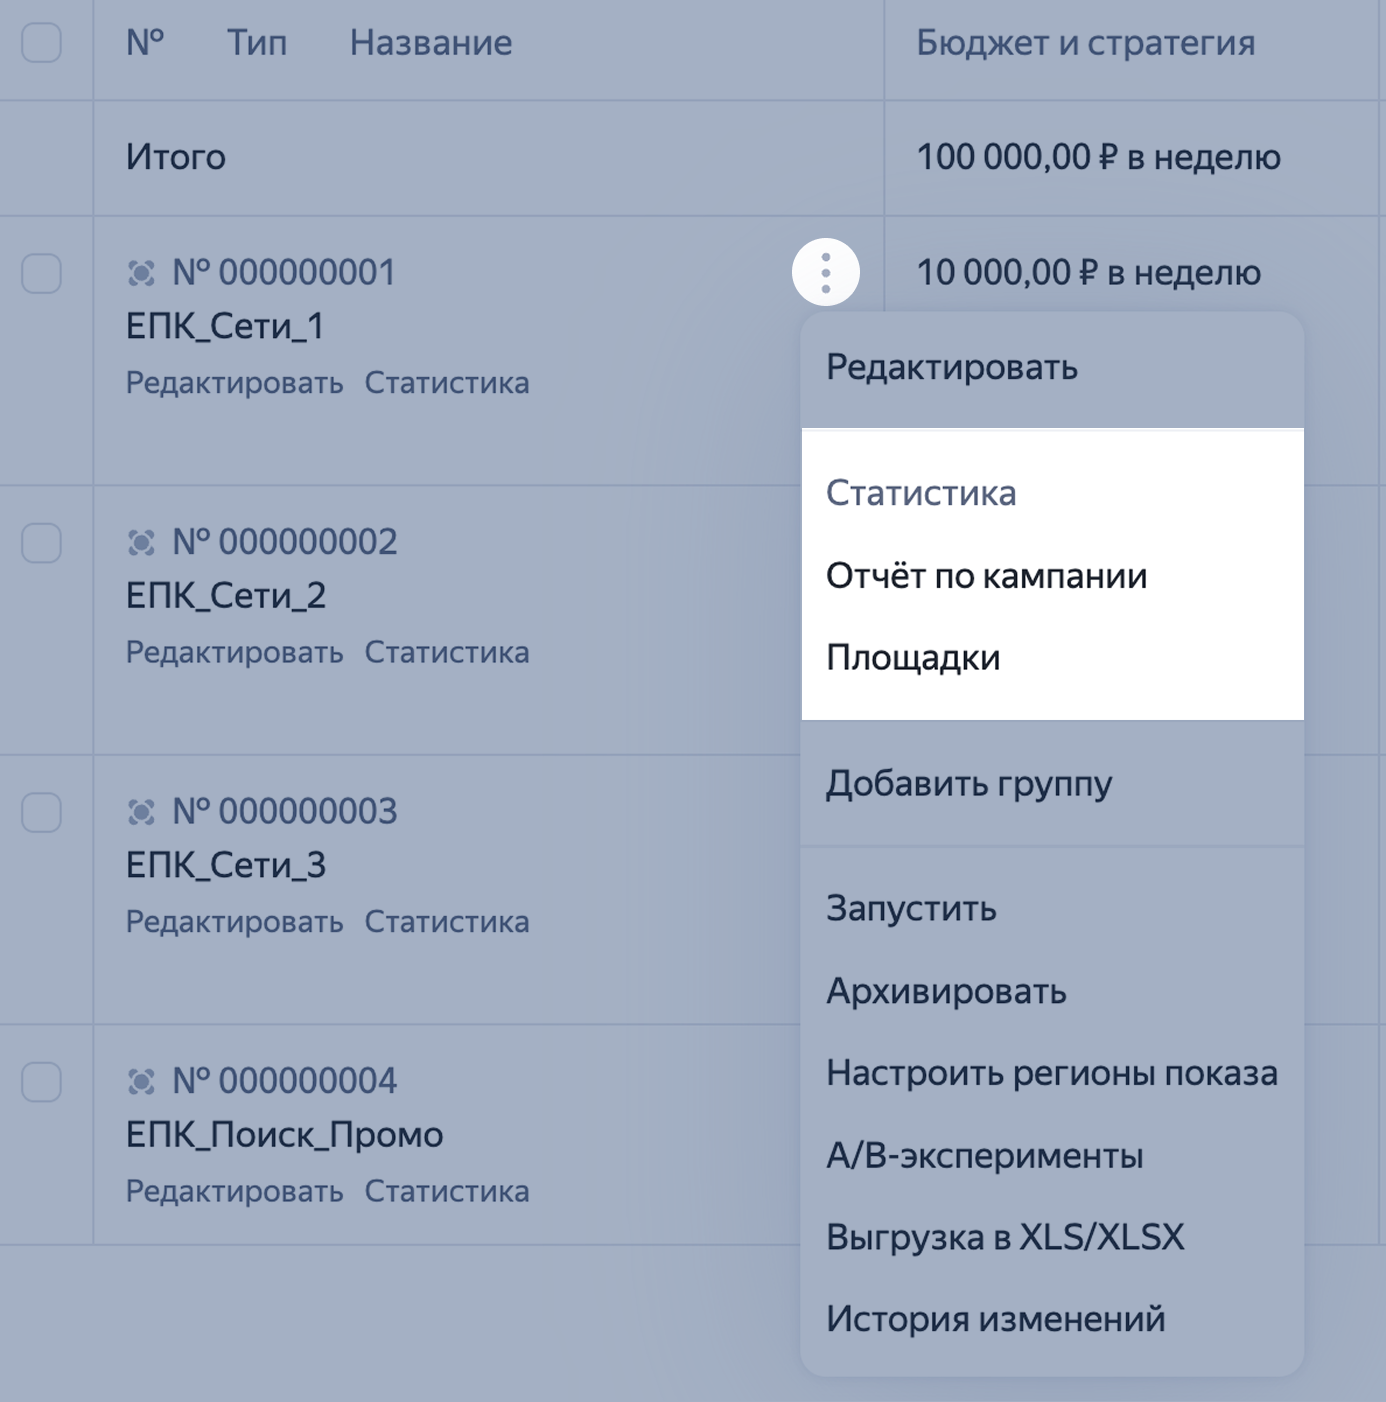
Alternatively, click Statistics under the campaign name and select New interface.
In both cases, this opens statistics for the selected campaign.
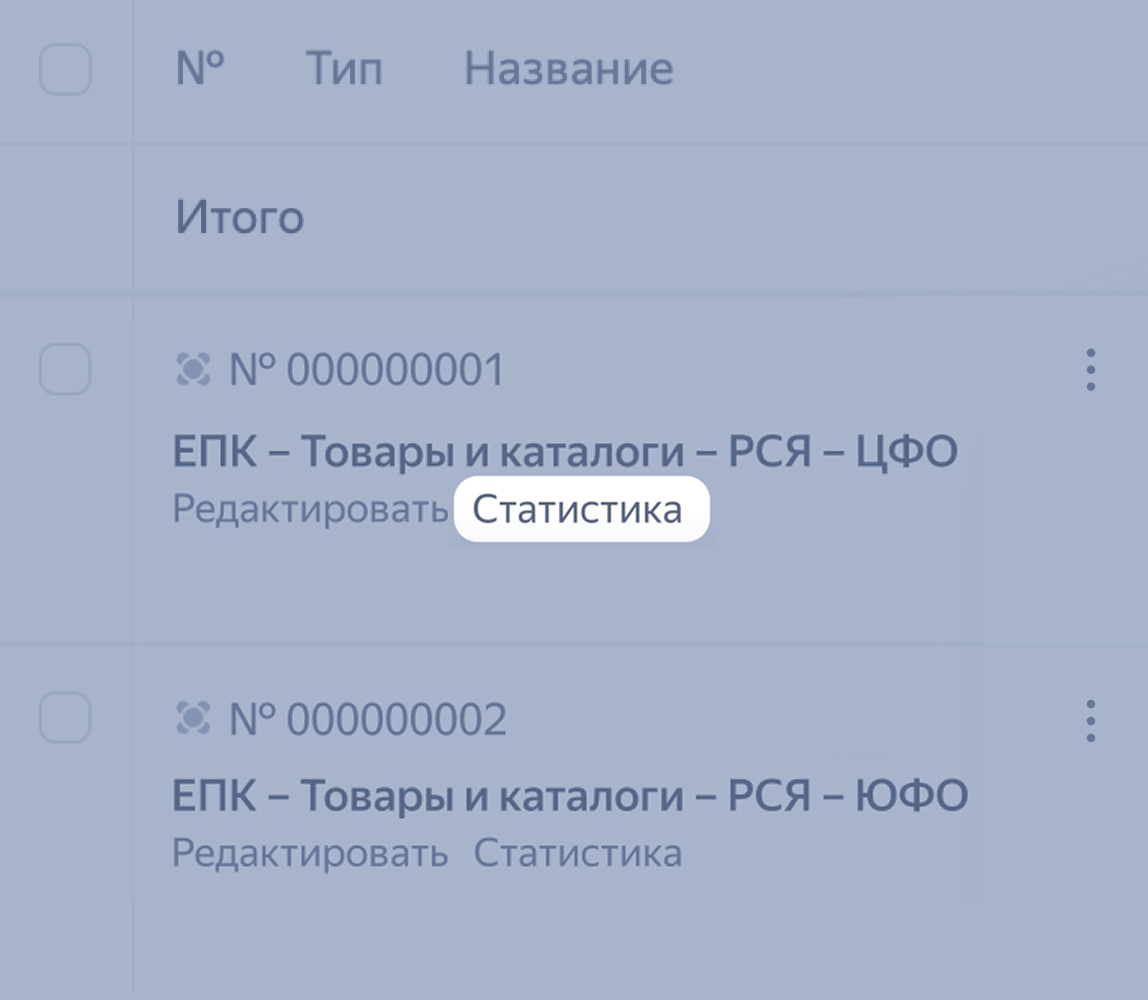
For product campaigns and campaigns created in the Campaign Wizard, you can also access the report by clicking Statistics under the campaign name or
→ Statistics.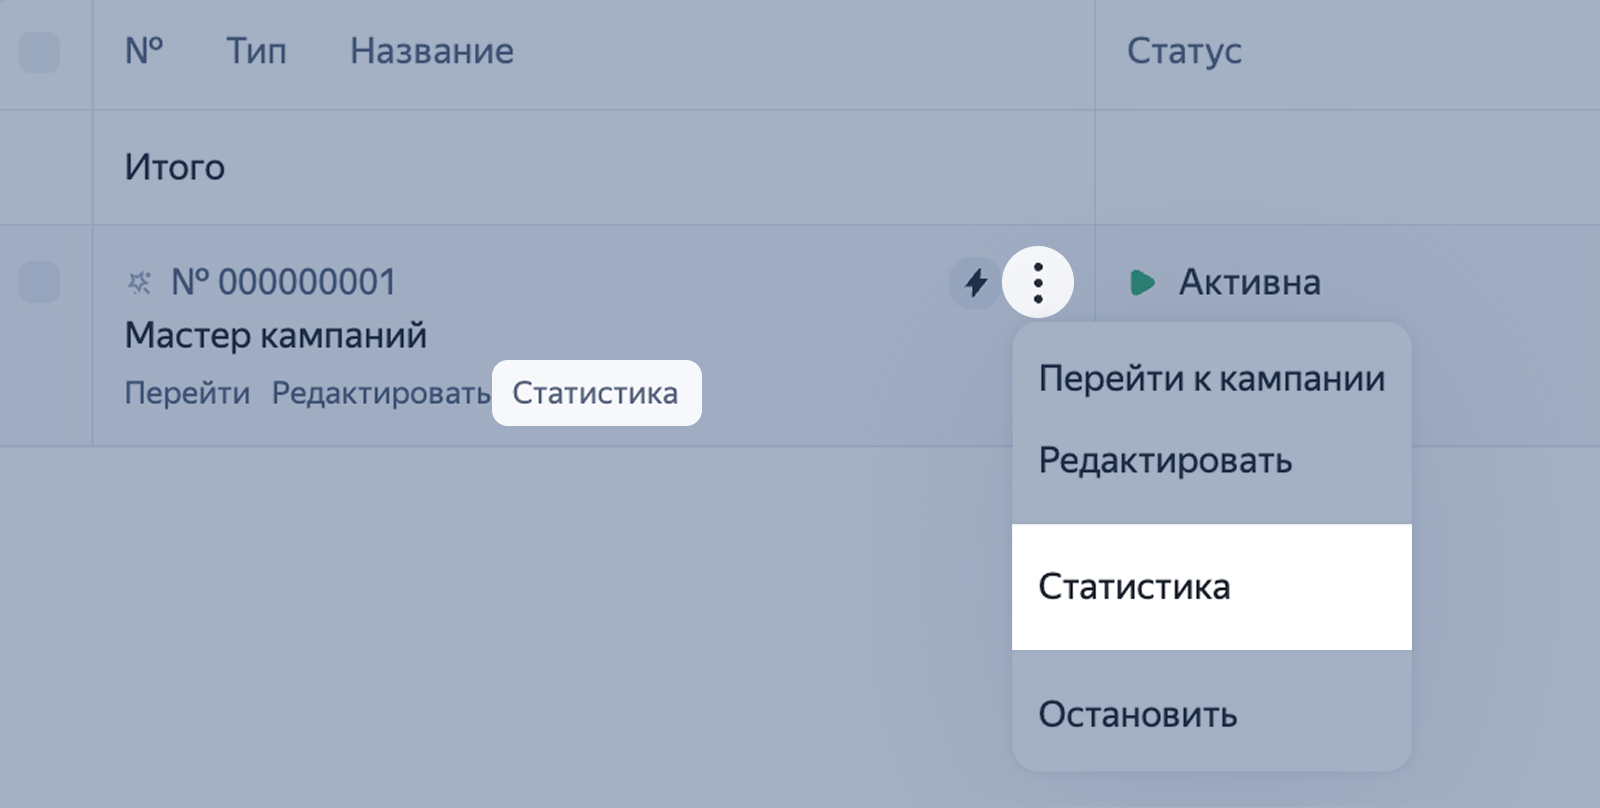
-
Select one or more campaigns — the buttons for viewing statistics will appear at the bottom.
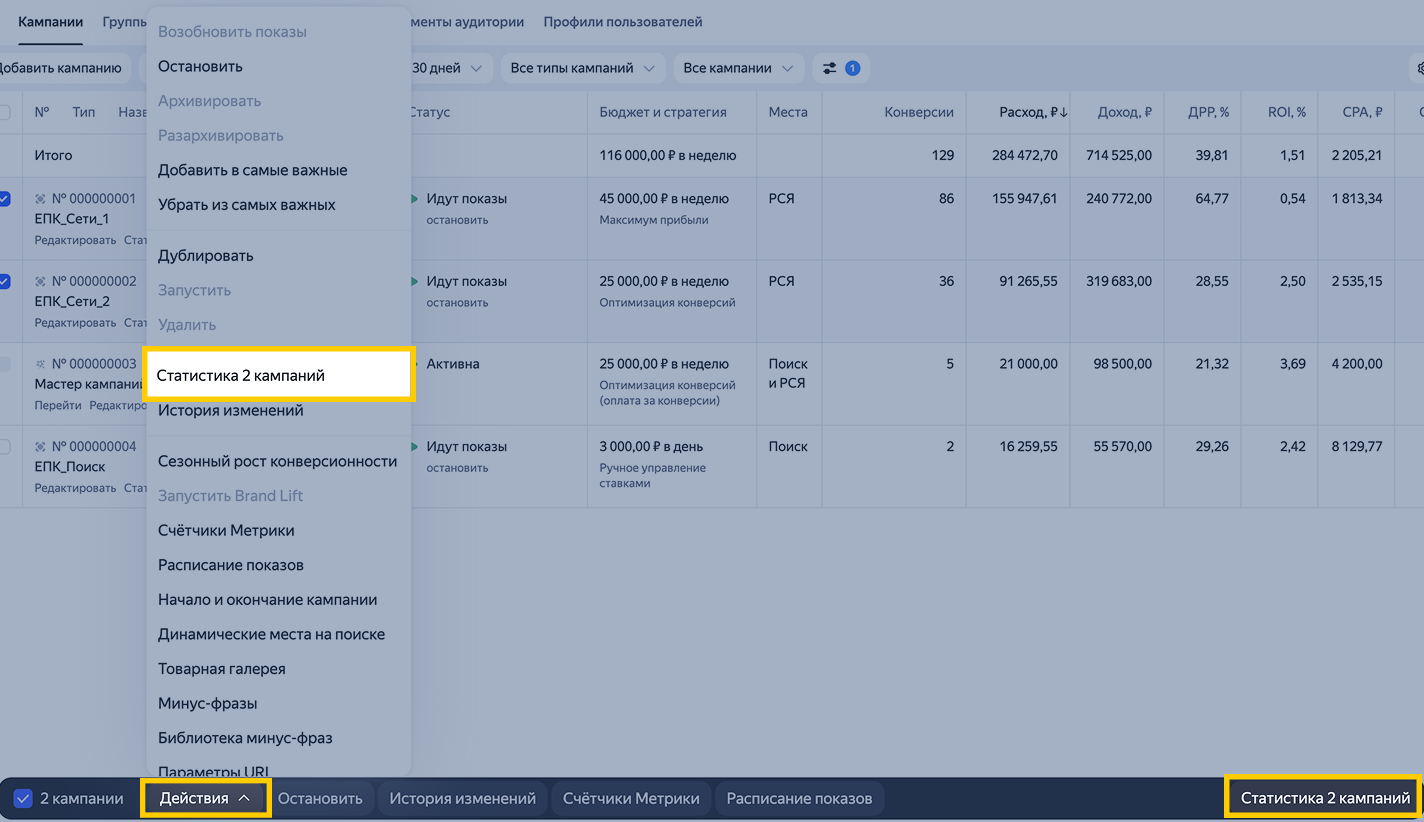
Click them to open statistics for the selected campaigns.
You can access the statistics for ads or ad groups the same way. On the campaigns page, switch to the group or ad level and select the items you need to view their statistics.
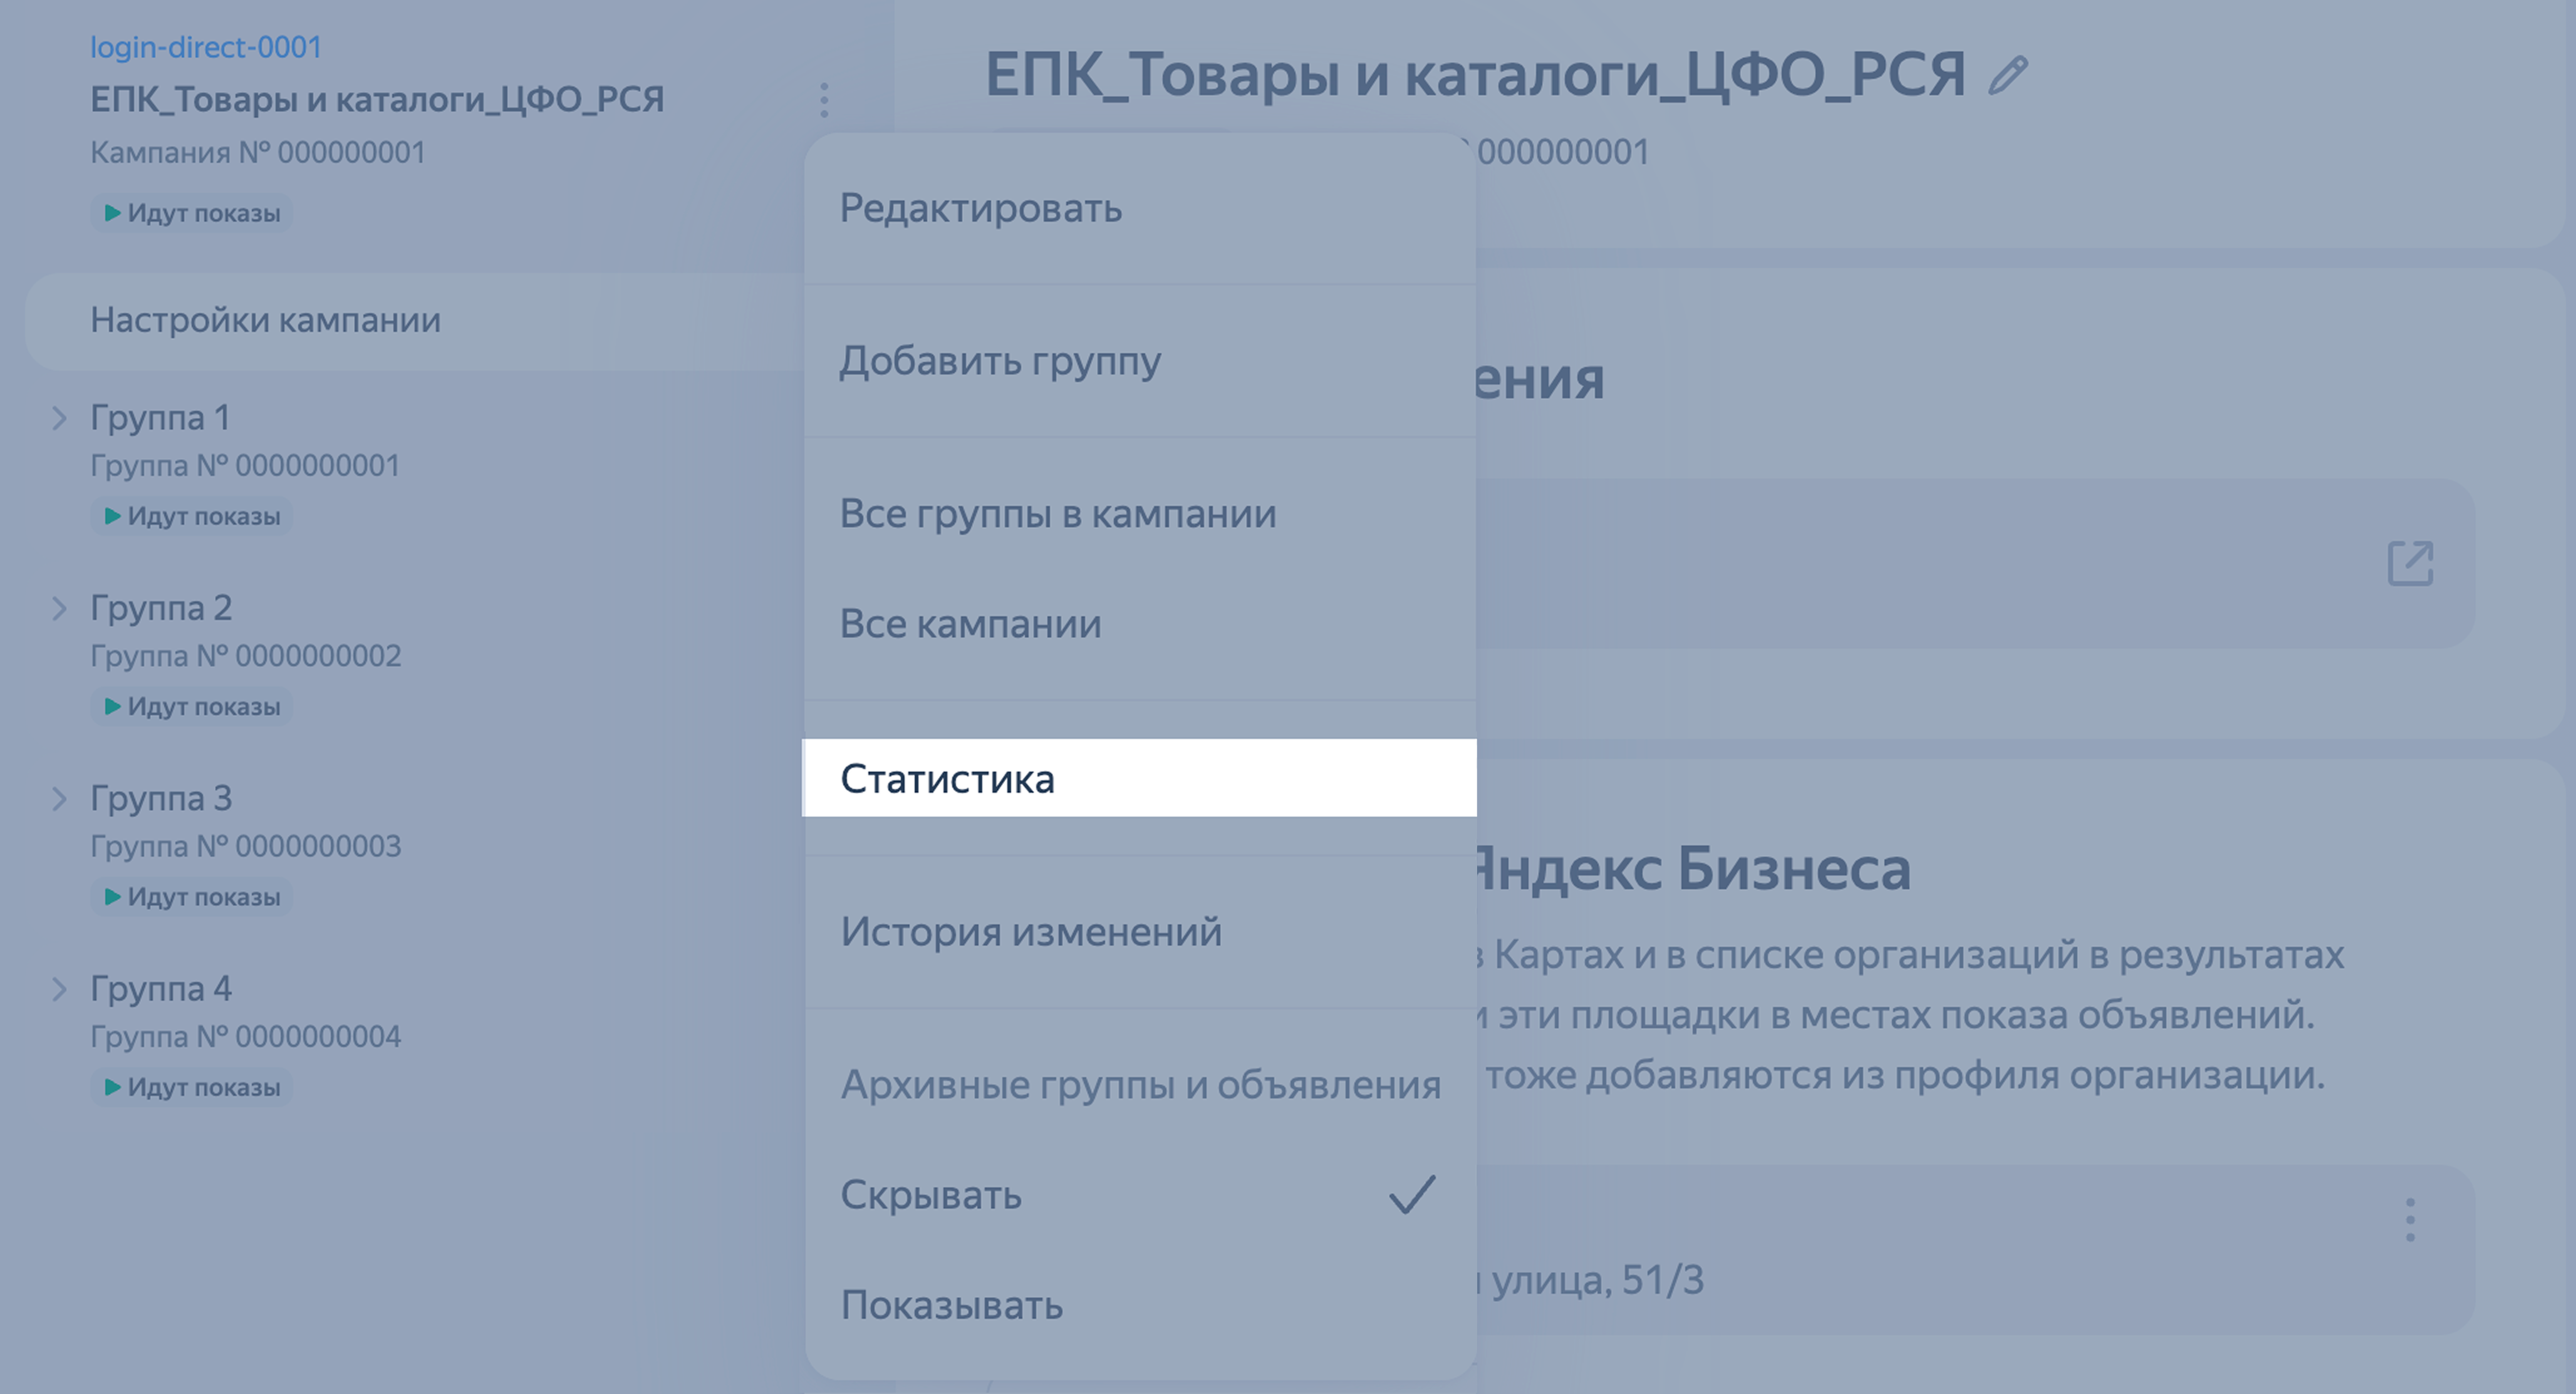
Campaign edit page
You can access statistics from the campaign edit page. This opens a library report that matches the campaign type: performance campaign, reach campaign, app promotion campaign, or other type.
Click next to the campaign name and select Statistics (New) from the drop-down list.
Have questions?
Alert
Our customer support can only assist you with campaigns linked to the username you are contacting us from. You can check your username by opening ya.ru in another browser tab. Our team can access your data only when processing your request.
Scan the QR code or tap it to follow the link.


If you select Telegram or WhatsApp, keep in mind that Yandex does not control and is not liable for how third-party messengers store your data and chat history.