Gantt chart in Tracker
A Gantt chart in Tracker is a tool for creating a timeline for working on issues.
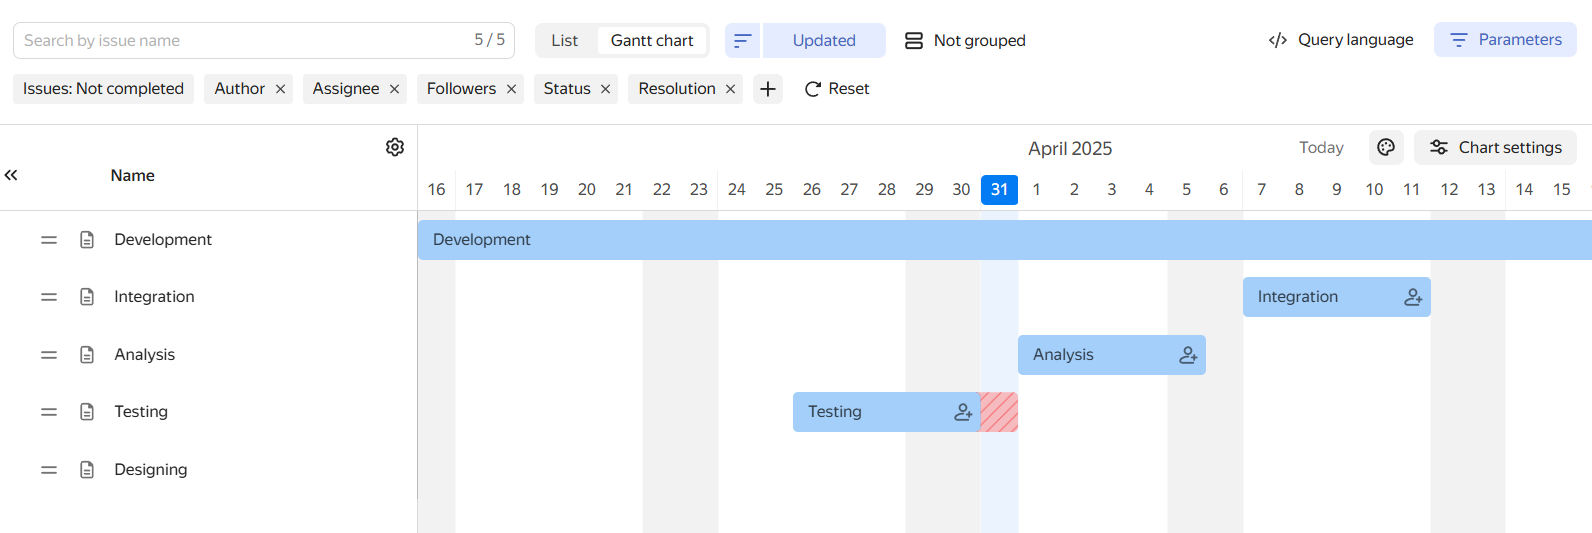
The deadlines of issues are shown on the chart as bars plotted along the time axis. The left edge of each bar indicates the start date of work on the issue, while the end of the bar shows its deadline. If a task is not closed by the deadline, the bar turns red.