Collecting request statistics
Managers and staff members of the support team often require various kinds of information about the ongoing issues as well as statistics on previously resolved requests. In Tracker, you can view all relevant information and statistics on a dashboard. First, create a dashboardand then add widgets. These may include issue lists, tables, and charts, all of which are created automatically based on filters.
For example, a manager can add to their dashboard a list of requests with no assignee and the statistics of opened and closed requests over a period. A support team member would make use of a list of issues assigned to them and a list of issues without an assignee that need to be accepted.
Let's look at the examples of widgets for support:
My issues
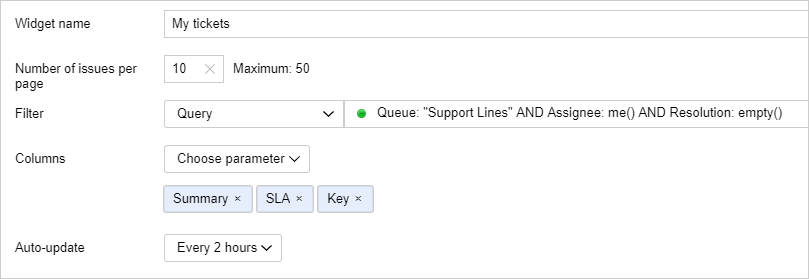
Add a widget with a list of issues assigned to your support team member to their personal dashboard:
-
On the dashboard page, click → Edit.
-
Add an Issues widget.
-
In the Issue source field, select Query language and enter the query text:
Queue: "<queue_name>" AND Assignee: me() AND Resolution: empty()In the selected queue, this query will find non-closed issues assigned to you.
-
To display the SLA rules timer in the issue list, add the SLA parameter to the Columns field.
-
Save your widget.
List of unassigned issues
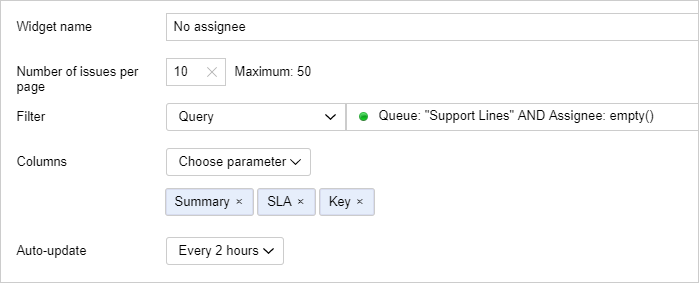
To make sure that your support team members can quickly find the requests without any assignee and accept them, add a list of such issues to the dashboard:
-
On the dashboard page, click → Edit.
-
Add an Issues widget.
-
In the Issue source field, select Query language and enter the query text:
Queue: "<queue_name>" AND Assignee: empty()This query will find issues without an assignee within the selected queue.
-
To display the SLA rules timer in the issue list, add the SLA parameter to the Columns field.
-
Save your widget.
Table with number of issues per assignee
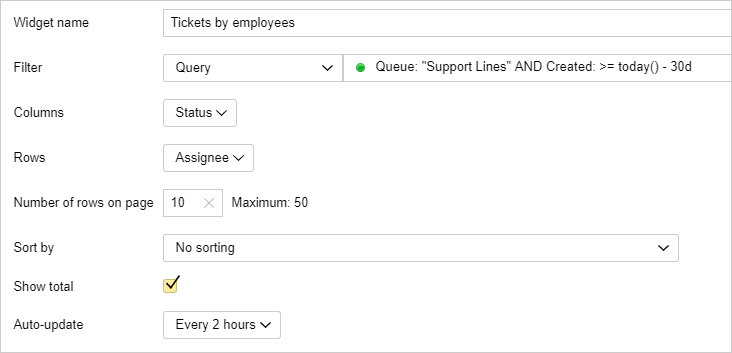
To get statistics about how many issues were assigned to your employees over the past 30 days, add the widget with the following table to your dashboard:
-
On the dashboard page, click → Edit.
-
Add a Summary table widget.
-
In the Issue source field, select Query language and enter the query text:
Queue: "<queue_name>" AND Created: >= today() - 30dThis query will find all issues created over the past 30 days within the selected queue.
-
In the Columns field, select Status, and in the Rows field, select Assignee. In this case, the table's cells will show the number of issues with a specific status for each assignee.
-
If you want to display the totals by columns and rows, select Show total.
-
Save your widget.
Statistics on open and resolved requests
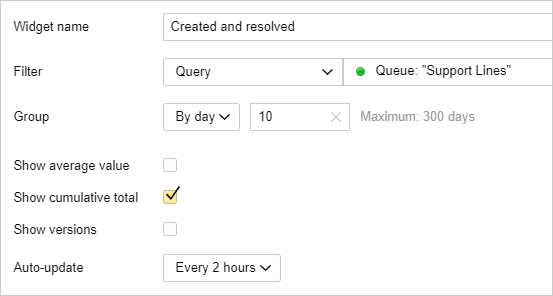
To watch the dynamics of creation and resolution of requests, add the following chart to the dashboard:
-
On the dashboard page, click → Edit.
-
Add a Created/Resolved chart widget.
-
In the Issue source field, select Query language and enter the query text:
Queue: "<queue_name>"This query will find all issues within the selected queue.
-
In the Group field, select By day and specify the number of days to be displayed on the chart.
-
If you want to display the totals for created and resolved requests on the chart, select Show cumulative total.
-
Save your widget.
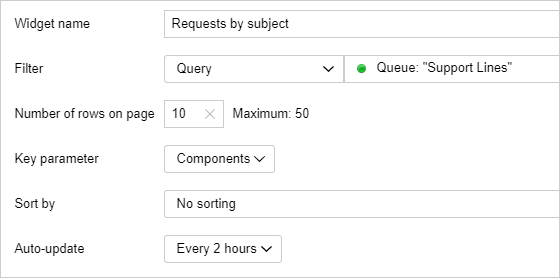
Request statistics by topic
If you use components to group issues by topic, you can create a chart that displays issue statistics by components:
-
On the dashboard page, click → Edit.
-
Add an Issue statistics widget.
-
In the Issue source field, select Query language and enter the query text:
Queue: "<queue_name>"This query will find all issues within the selected queue.
-
In the Key parameter field, select Components.
-
Save your widget.