Visualizing data from Yandex Tracker
Visualizing data from Tracker to DataLens allows you to build more advanced analytics than when using the Tracker tools.
To visualize data from Tracker to DataLens:
- Set up regular export of data to external storage.
- Visualize the required metrics and data using DataLens.
To visualize the data, follow these steps:
- Prepare your cloud.
- Create a DB for storing the Tracker data.
- Create an OAuth token for Tracker access.
- Create a Cloud Functions function for importing the data.
- Create a connection to DataLens.
- Create a dataset.
- Create a chart.
- Create a dashboard in DataLens and add charts to it.
Getting started
To obtain data, log in to Tracker under the account of a user with full access to the service.
Sign up for Yandex Cloud and create a billing account:
- Go to the management console and log in to Yandex Cloud or create an account if you do not have one yet.
- On the Billing page, make sure you have a billing account activated and its status is
ACTIVEorTRIAL_ACTIVE. If you do not have a billing account, create one.
If you have an active billing account, you can create or select a folder on the cloud page to host your infrastructure.
Learn more about clouds and folders.
Required paid resources
- A paid service plan that grants full access to Tracker.
- A continuously running Managed Service for ClickHouse® cluster (see Managed Service for ClickHouse® pricing).
- Cloud Functions function usage (see Cloud Functions pricing).
If you no longer need the resources you created, delete them.
Create a DB for storing the Tracker data
- Go to the management console.
- In the top-left corner, click All services.
- Select Data platform → Managed Service for ClickHouse.
- Click Create ClickHouse cluster.
- Specify the cluster parameters:
- Basic parameters:
- Environment:
PRODUCTION. - Version:
24.8 LTS.
- Environment:
- Resources:
- Platform:
Intel Ice Lake. - Type:
Standard. - Host class:
s3-c2-m8 (2 vCPU, 8 GB).
- Platform:
- Storage size:
30 GB. - Hosts:
- Public access:
Enabled.
- Public access:
- DBMS settings:
- User management via SQL:
Disabled. - Database management via SQL:
Disabled. - Username:
tracker_data. - DB name:
db1.
- User management via SQL:
- Service settings:
- DataLens access:
Enabled. - Access from Serverless:
Enabled.
For a full list of settings, see Managed Service for ClickHouse® settings.
- DataLens access:
- Basic parameters:
- Click Create cluster. Wait for the created cluster status to change to
Alive. - Copy and save the host name for further Cloud Functions setup.
Create an OAuth token for Tracker access
If you use a federated or service account, authenticate using an IAM token.
To get a token:
-
Go to https://oauth.yandex.com/.
-
On the Your applications page, click Create.
-
In the window that opens, select the For API access or debugging option and click Proceed to creation.
-
Specify the application name and contact email.
-
Add permissions to access user data. To select a permission, start typing its name in the Access name field:
- Write to tracker (tracker:write) — all data operations: create, delete, edit.
- Read from tracker (tracker:read) — read-only access to data.
-
Click Create application.
-
In the Yandex OAuth personal account, select the previously created application and copy its ID from the ClientID field.
-
Generate the token request link:
https://oauth.yandex.com/authorize?response_type=token&client_id=<application_id> -
Log in to the account on whose behalf you will work with the API and go to the generated link.
A sequence of characters will appear on the page — this is the OAuth token. Copy it and save it.
To check if you have access to the API, execute the request for information about the current user. If access was not obtained, the request will return a response with code 401 Unauthorized.
Example request for information about the current user using curl:
curl -X GET 'https://api.tracker.yandex.net/v3/myself' \
     -H 'Authorization: OAuth y0__xAbc******' \
     -H 'X-Org-ID: 1234******'
curl -X GET "https://api.tracker.yandex.net/v3/myself" ^
     -H "Authorization: OAuth y0__xAbc******" ^
     -H "X-Org-ID: 1234******"
Create a Cloud Functions function for importing the data
- Go to the management console.
- In the top-left corner, click All services.
- Select Serverless computing → Cloud Functions.
- Click Create function.
- Specify a name for the function and click Create.
- In the Editor window that opens, select
Python / 3.9runtime environment. - Click Next.
- In the Method field, click ZIP archive.
- Attach a test archive.
- In the Entry point field, specify
tracker_import.handler. - Under Parameters, specify:
- Timeout, sec:
60. - RAM:
1024. - Environment variables:
-
TRACKER_ORG_ID: Yandex 360 for Business organization IDTo get the organization ID, go to Administration → Organizations and copy the value from the ID field.
-
TRACKER_OAUTH_TOKEN: OAuth token of the Tracker account -
CH_HOST: Host name -
CH_DB: Database name -
CH_USER: Username -
CH_PASSWORD: Password -
CH_ISSUES_TABLE:tracker_issues -
CH_CHANGELOG_TABLE:tracker_changelog -
TRACKER_INITIAL_HISTORY_DEPTH:1d -
CH_STATUSES_VIEW:v_tracker_statuses
-
- Timeout, sec:
- Click Save changes.
- In the Testing tab, click Run test.
- The test result is a data import log:
{ "statusCode": 200, "headers": { "Content-Type": "text/plain" }, "isBase64Encoded": false, "body": "OK" } - Create a trigger for regular exports of new data to the database:
- Go to the Cloud Functions section.
- Click → Create trigger.
- Set the trigger type to Timer.
- In the Cron expression field, select
Every day. - Under Function settings, click Create new.
- Enter the account name. By default, the account is assigned the
functions.functionInvokerrole to use the trigger. - Click Create.
- Click Create trigger.
Create a connection in DataLens
-
Open your Managed Service for ClickHouse® cluster.
-
On the left side of the window, select DataLens.
-
Click Create connection.
-
Specify the connection settings:
-
Connection:
Select in a folder. -
Cluster: Cluster specified when creating a database.
-
Hostname: Host specified when creating a database.
-
HTTP interface port:
8443. -
Username: Username specified when creating a database.
-
Password: Password specified when creating a database.
-
Cache TTL in seconds:
Default. -
Raw SQL level:
Forbid. -
HTTPS:
Enabled.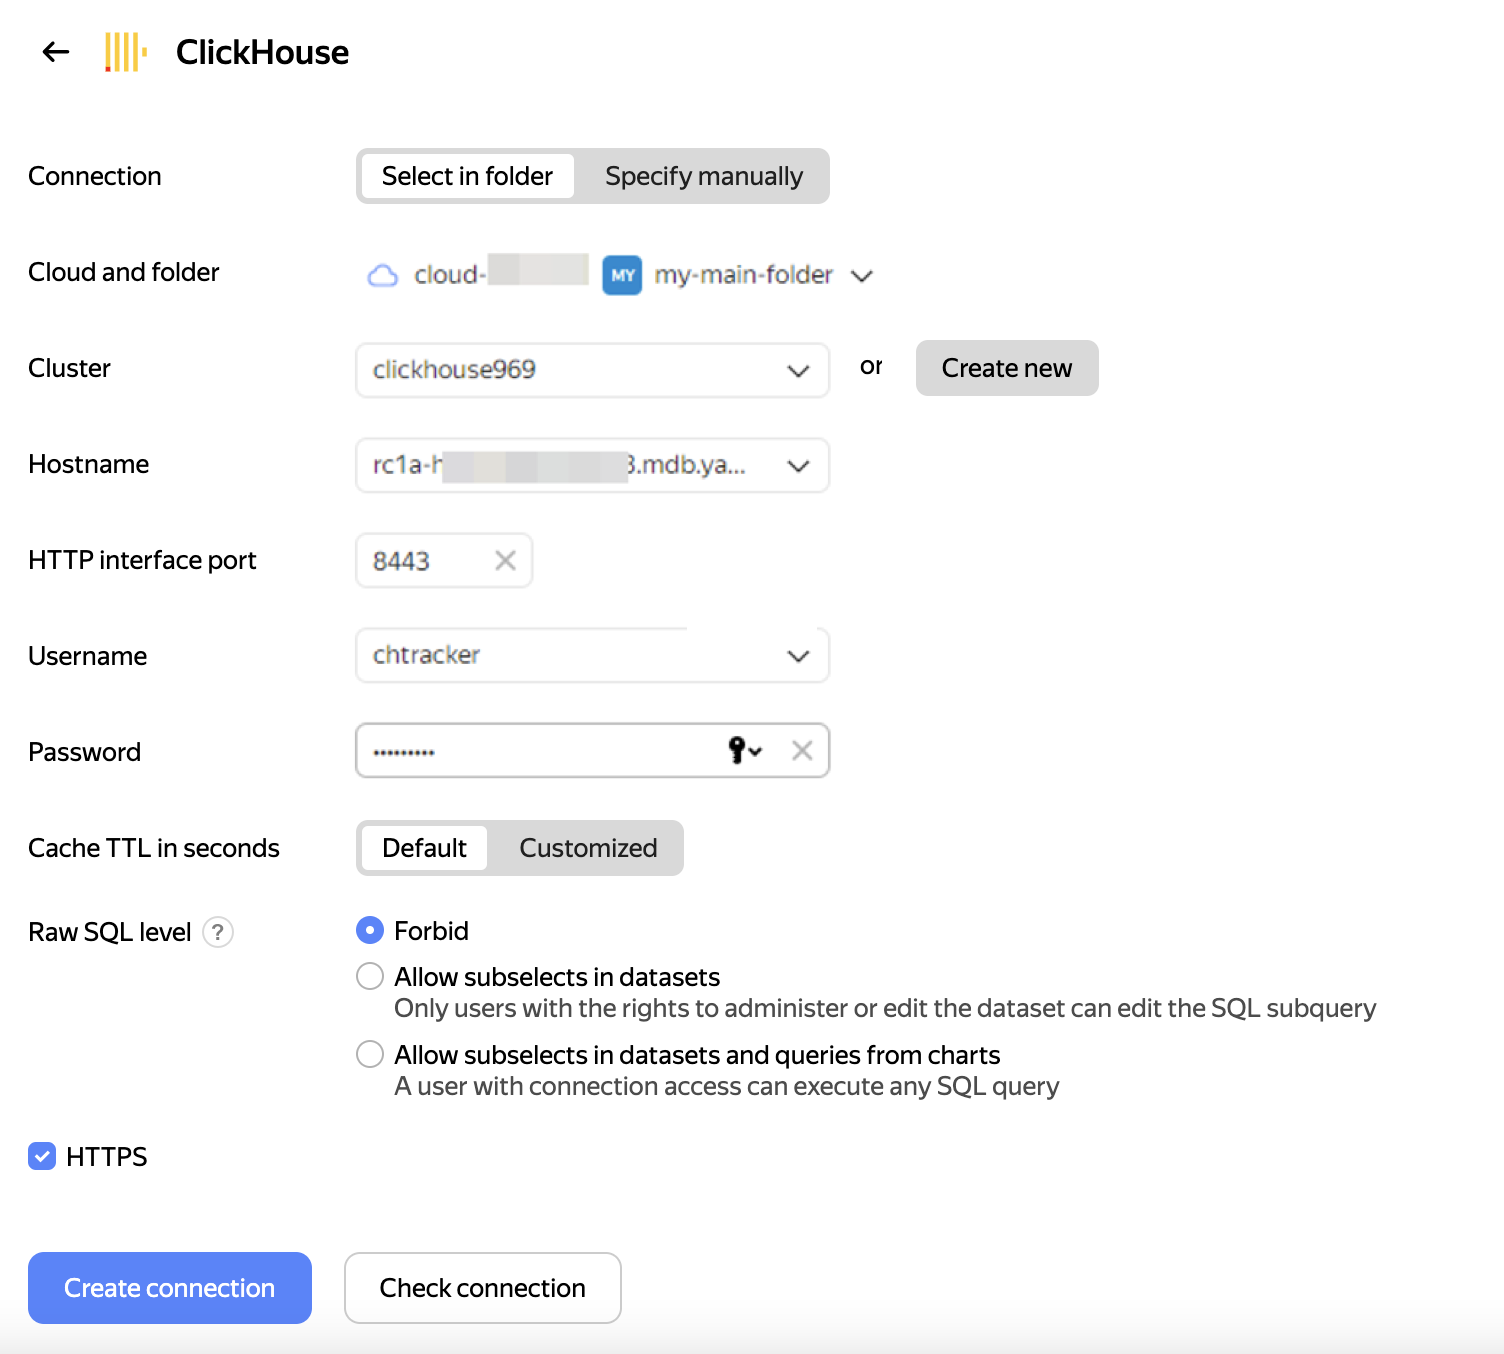
-
-
Click Create connection.
Create a dataset
- Go to the connections page.
- Select a connection.
- In the top-right corner, click Create dataset.
- Drag one or more tables to the workspace:
db1.v_tracker_issues: Current (most recent) issue cross-section.db1.v_tracker_changelog: Issue parameter change history.Db1.v_tracker_statuses: Status transition time based on the issue change history.
- Click Save.
Create a chart
- Go to the DataLens home page.
- Click Create chart.
- In the top left corner, click Select dataset.
- In the Datasets drop-down list, select the dataset you created in the previous step.
- On the top panel, select a visualization type. By default, the Column chart type is selected.
Create a dashboard and add charts to it
-
On the DataLens home page, click Create dashboard.
-
At the top of the dashboard page, click Add → Chart.
-
Fill in the widget parameters. Pay close attention to the following fields:
- Name: Sets the name of the widget. It is displayed at the top of the widget.
- Chart: Sets the widget to add.
- Description: Sets the description of the widget. It is displayed at the bottom of the widget.
- Auto height: Sets the automatic height for Table and Markdown widgets. If this parameter is disabled, you can set the height of the widget on the page using the mouse.
-
Click Add. The widget will be displayed on the dashboard.
-
Save the dashboard:
- In the top-right corner of the dashboard, click Save.
- Enter a name for the dashboard and click Create.
For more information about setting up dashboards, see DataLens dashboard.
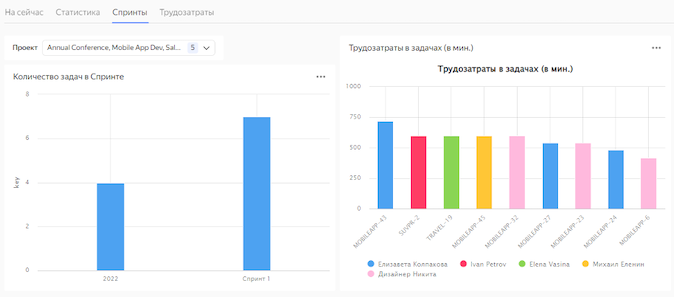
Sample dashboard based on data from the v_tracker_issues table
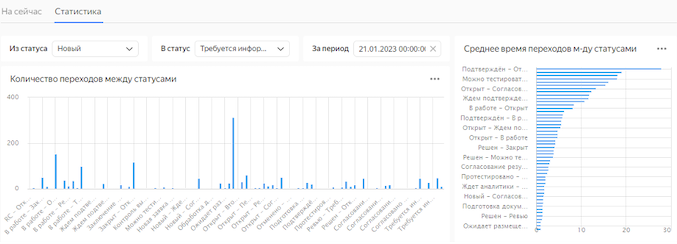
Sample dashboard based on data from the db1.v_tracker_statuses table
How to delete the resources you created
To stop paying for the resources you created:
ClickHouse® is a registered trademark of ClickHouse, Inc.