Created/Resolved chart
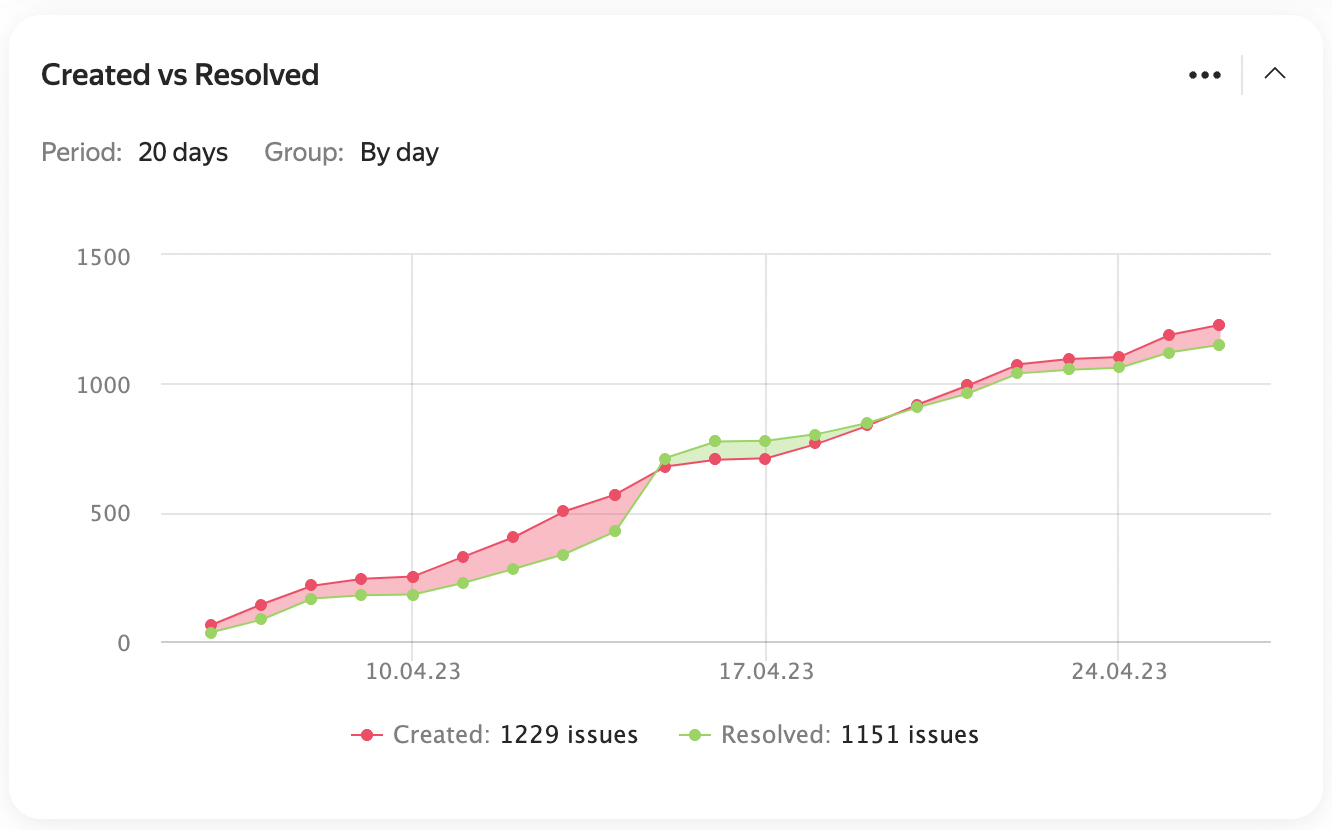
The chart shows how many issues were created and how many were resolved over a selected period. It helps you assess how the team's workload changes and whether employees manage to close issues at the same rate they appear.
If your queue has multiple final statuses configured (for example, Resolved and Closed), an issue will appear on the chart only if it was closed with a resolution.
Example chart
Widget actions
To view the list of issues at a specific point on the chart, click the point.
To open issues for the entire chart period, click Created or Resolved at the bottom.

To enlarge a section of the chart, select it with your mouse.
To return to the original scale, click Reset zoom on the right.

Widget settings
-
Data source — the issue search conditions for the widget. You can specify them in different formats:
<!-- source: en/_includes/dashboards.md --> - **Filter** — here you can select a quick filter, such as "Reported by me", or your saved filter. [How to save an issue filter](create-filter.md) - **Query language** — here you can enter a condition in query format. Choose this if you need to insert a function or combine several conditions with the "AND" and "OR" operators. [How to set a condition using the query language](query-filter.md) - **Parameters** — here you can set up a condition using buttons. [How to add search conditions](create-filter.md#set-conditions) <!-- endsource: en/_includes/dashboards.md --> -
Group — the chart step on the time axis. You can select different units, from hours to years.
In the field on the right, specify the axis length in days. -
Show average value: Enable to add another chart showing the difference between the number of created and resolved issues.
-
Show cumulative total — enable this option to show the total across all previous periods.
-
Show versions: Enable to see the versions that issues belong to on the chart.
-
Auto-update — how often the widget will update.

Example settings
A resolution is an issue parameter that shows why an issue was closed. For example: Resolved, Won't fix, or Duplicate. You can add resolutions in the queue settings. How to set up resolutions
A version is a parameter that groups queue issues by product version. You can add versions in the queue settings. How to create a version