Events chart widget
The widget shows the number of issues with a specific date selected. For example, select the key parameter Deadline and track the number of issues with approaching deadlines. Or select the Resolved parameter and collect statistics on how many issues your team closes.
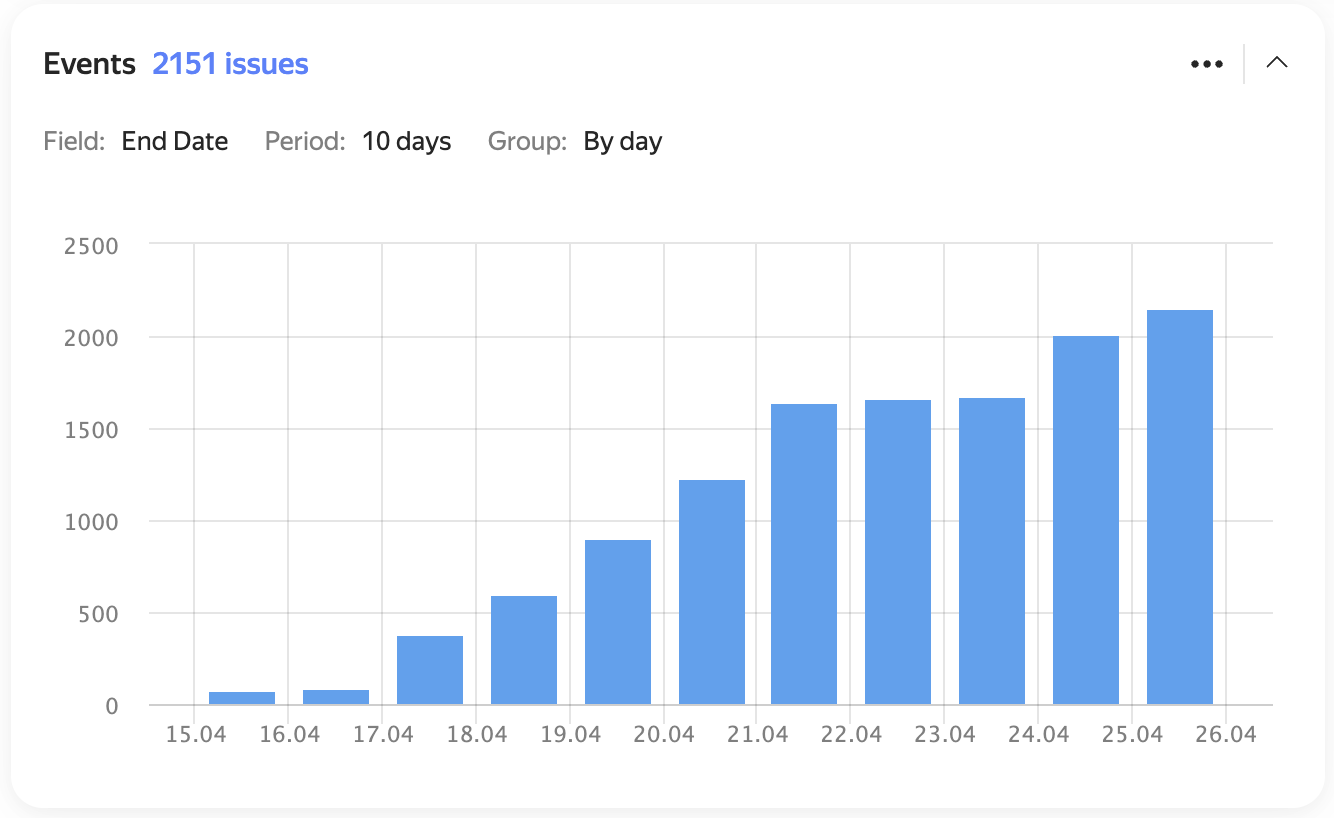
Example chart
Widget actions
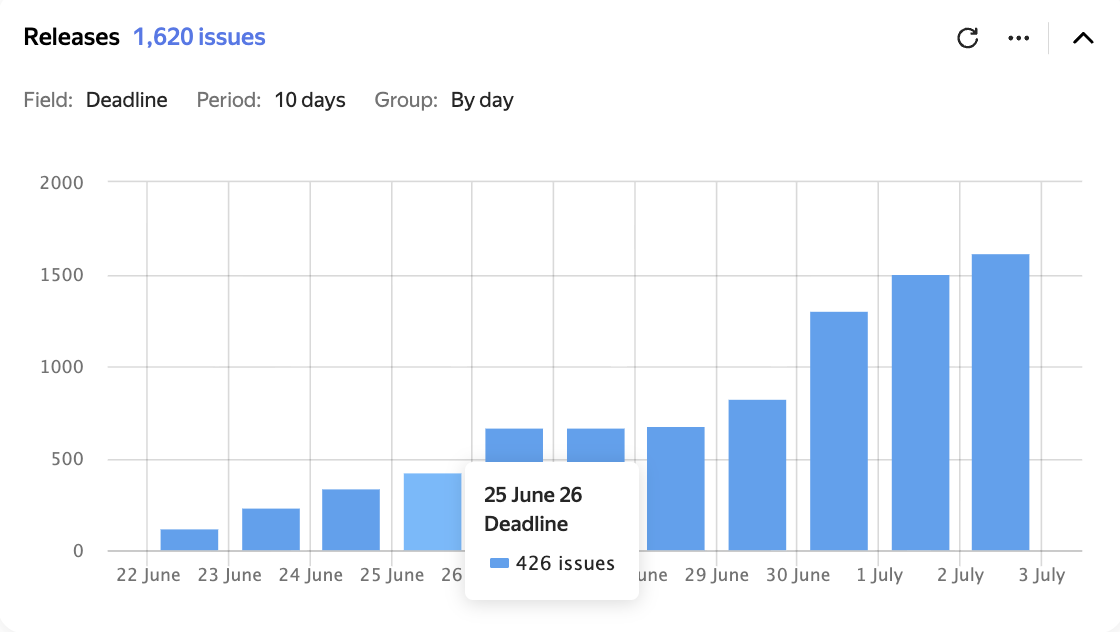
To open the list of issues, click a column.
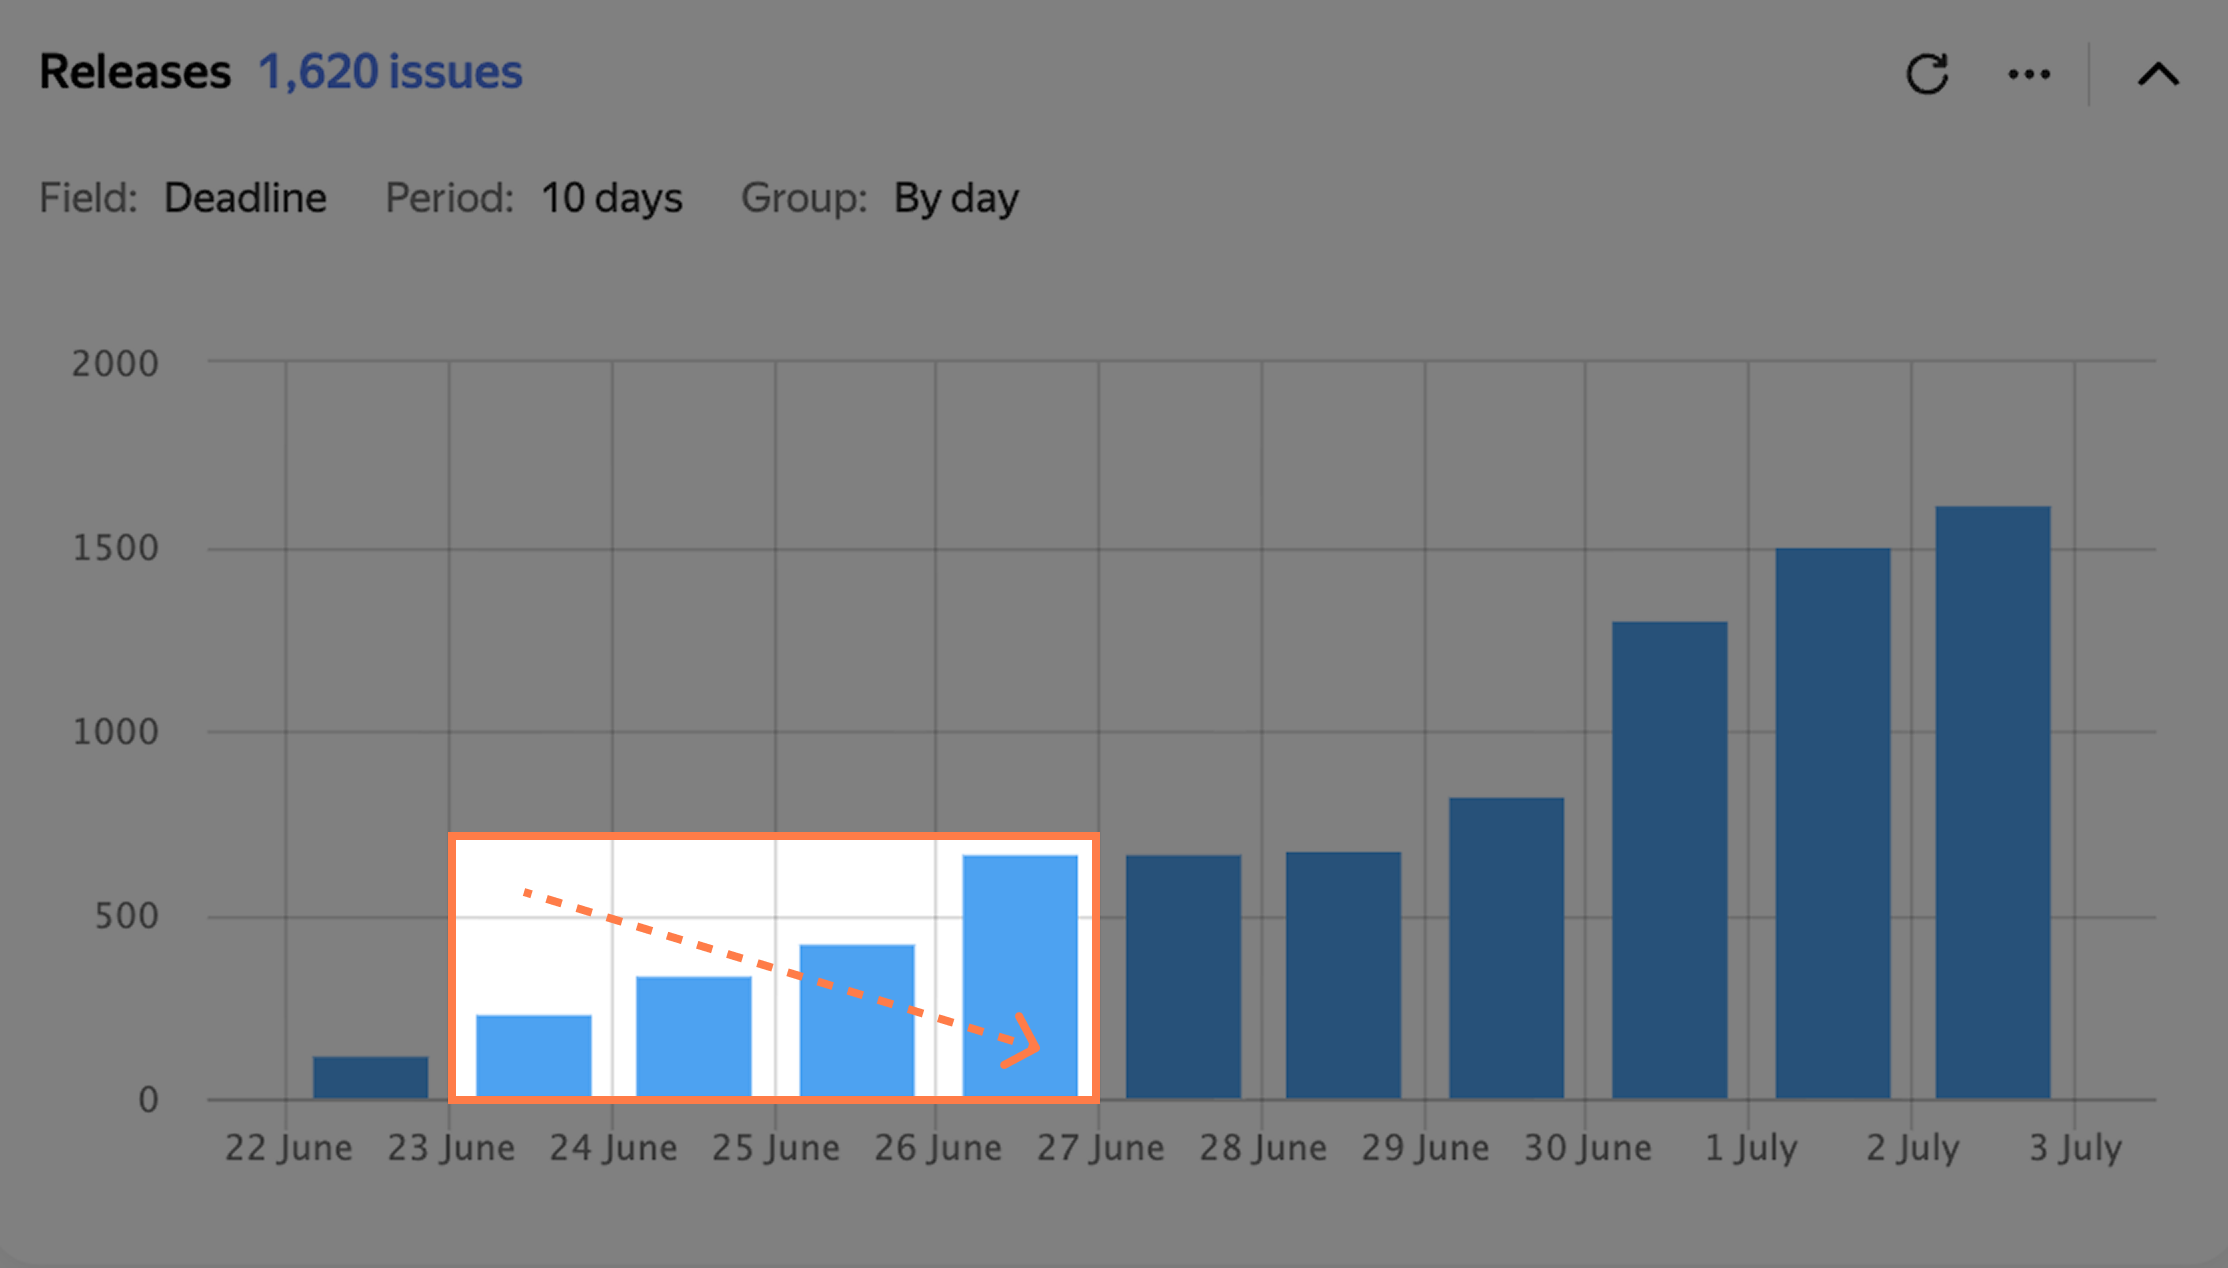
To enlarge an area of the chart, select it with the mouse.
To return to the original scale, click Reset zoom on the right.
Widget settings
-
Data source — the issue search conditions for the widget. You can specify them in different formats:
- Filter — here you can select a quick filter, such as "Reported by me", or your saved filter. How to save an issue filter
- Query language — here you can enter a condition in query format. Choose this if you need to insert a function or combine several conditions with the "AND" and "OR" operators. How to set a condition using the query language
- Parameters — here you can set up a condition using buttons. How to add search conditions
-
Key parameter — the issue parameter to build the chart for.
It must contain a date or time. -
Group — the chart step on the time axis. You can select different units, from hours to years.
In the field on the right, specify the axis length in days. -
Show cumulative total — enable this option to show the total across all previous periods.
-
Auto-update — how often the widget will update.
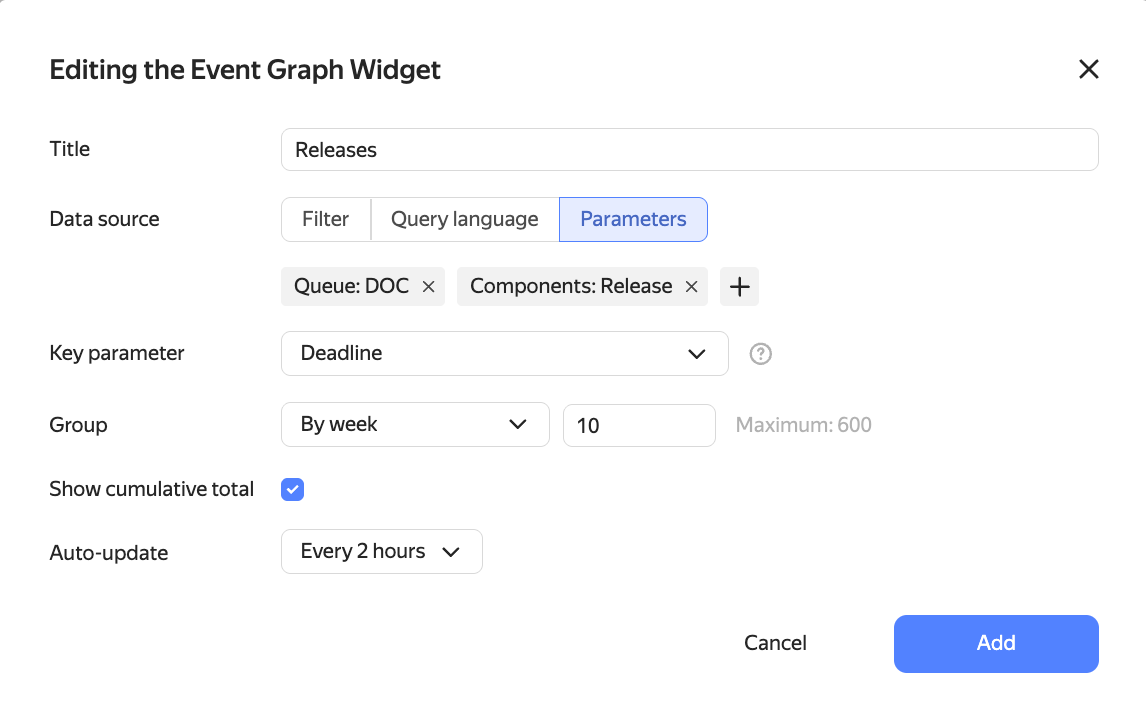
Example settings