Issue statistics widget
The widget shows how issues are distributed — by count and percentage.
For example, select issues for a specific project and track its progress by the Status parameter. The left side of the column shows the number of issues in the status, and the right side shows the percentage of the total number of project issues. To open the list of issues, click the column.
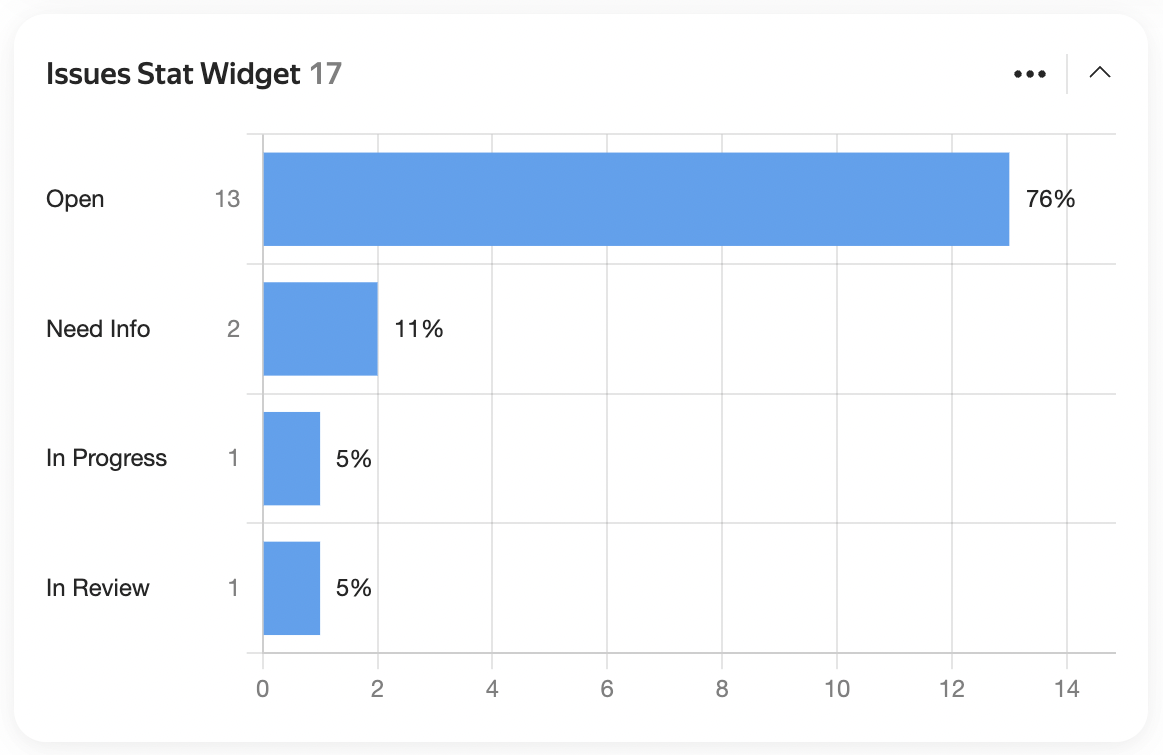
Example chart
Widget settings
-
Data source — the issue search conditions for the widget. You can specify them in different formats:
- Filter — here you can select a quick filter, such as "Reported by me", or your saved filter. How to save an issue filter
- Query language — here you can enter a condition in query format. Choose this if you need to insert a function or combine several conditions with the "AND" and "OR" operators. How to set a condition using the query language
- Parameters — here you can set up a condition using buttons. How to add search conditions
-
Issues on page — how many columns to show on the chart. If there are more columns than specified, the Show all button will appear at the bottom of the widget.
-
Key parameter — the issue field for which the chart will be built.
-
Sorting — how to order the data on the widget.
-
Auto-update — how often the widget will update.
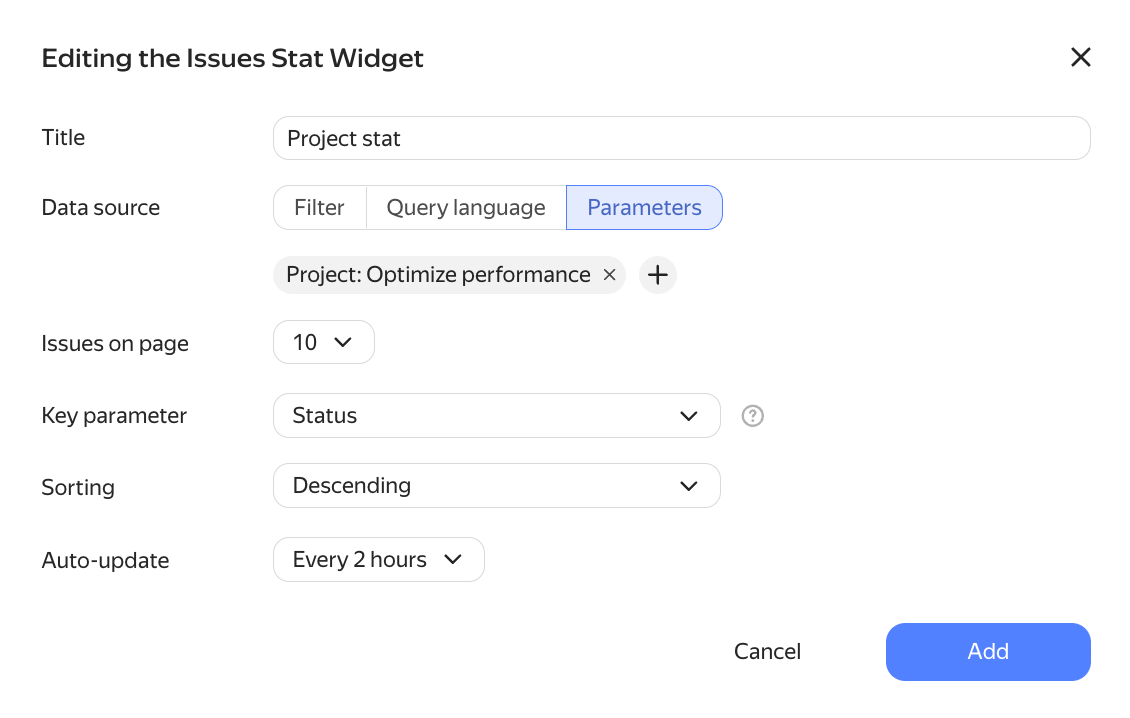
Example settings