Team performance
Using the Team performance widget, you can calculate and display the amount of work a team completes over a specific period. The performance metric helps you predict how many issues or stories the team can complete in one sprint or another defined period. In addition, tracking performance helps you assess how changes in various processes impact your team's efficiency.
You can calculate this metric based on any numeric issue field or the number of completed issues. An issue is completed when it moves to one of the final statuses you specified.
To configure a widget, set the following:
-
Name: Enter a widget title.
-
Data source: Select a filter to choose which issues appear on the chart. You can select one of the system or custom filters from the list. Alternatively, you can define a filter using the query language or issue parameters. For more information, see Creating and configuring an issue filter.
<!-- source: en/_includes/dashboards.md --> - **Filter** — here you can select a quick filter, such as "Reported by me", or your saved filter. [How to save an issue filter](create-filter.md) - **Query language** — here you can enter a condition in query format. Choose this if you need to insert a function or combine several conditions with the "AND" and "OR" operators. [How to set a condition using the query language](query-filter.md) - **Parameters** — here you can set up a condition using buttons. [How to add search conditions](create-filter.md#set-conditions) <!-- endsource: en/_includes/dashboards.md --> -
Period: Specify a period for the chart. To make sure the chart period starts from the current date when the widget updates, go to the Main or Other tab and select a dynamic date range such as Last month.
-
Time intervals: Specify the time span each chart column represents. You can specify the step in days, weeks, months, or sprints.
-
Automatic update: Enable this option if you want the chart to refresh automatically. The update frequency depends on the Time intervals parameter.
-
Calculate the volume of issues based on: Select a method for measuring performance:
-
Field value: Select an issue field with a numeric value (Story Points by default). The chart column will show the total of all values for the selected field across all completed issues.
-
Issue count: The chart column will show the number of completed issues.
-
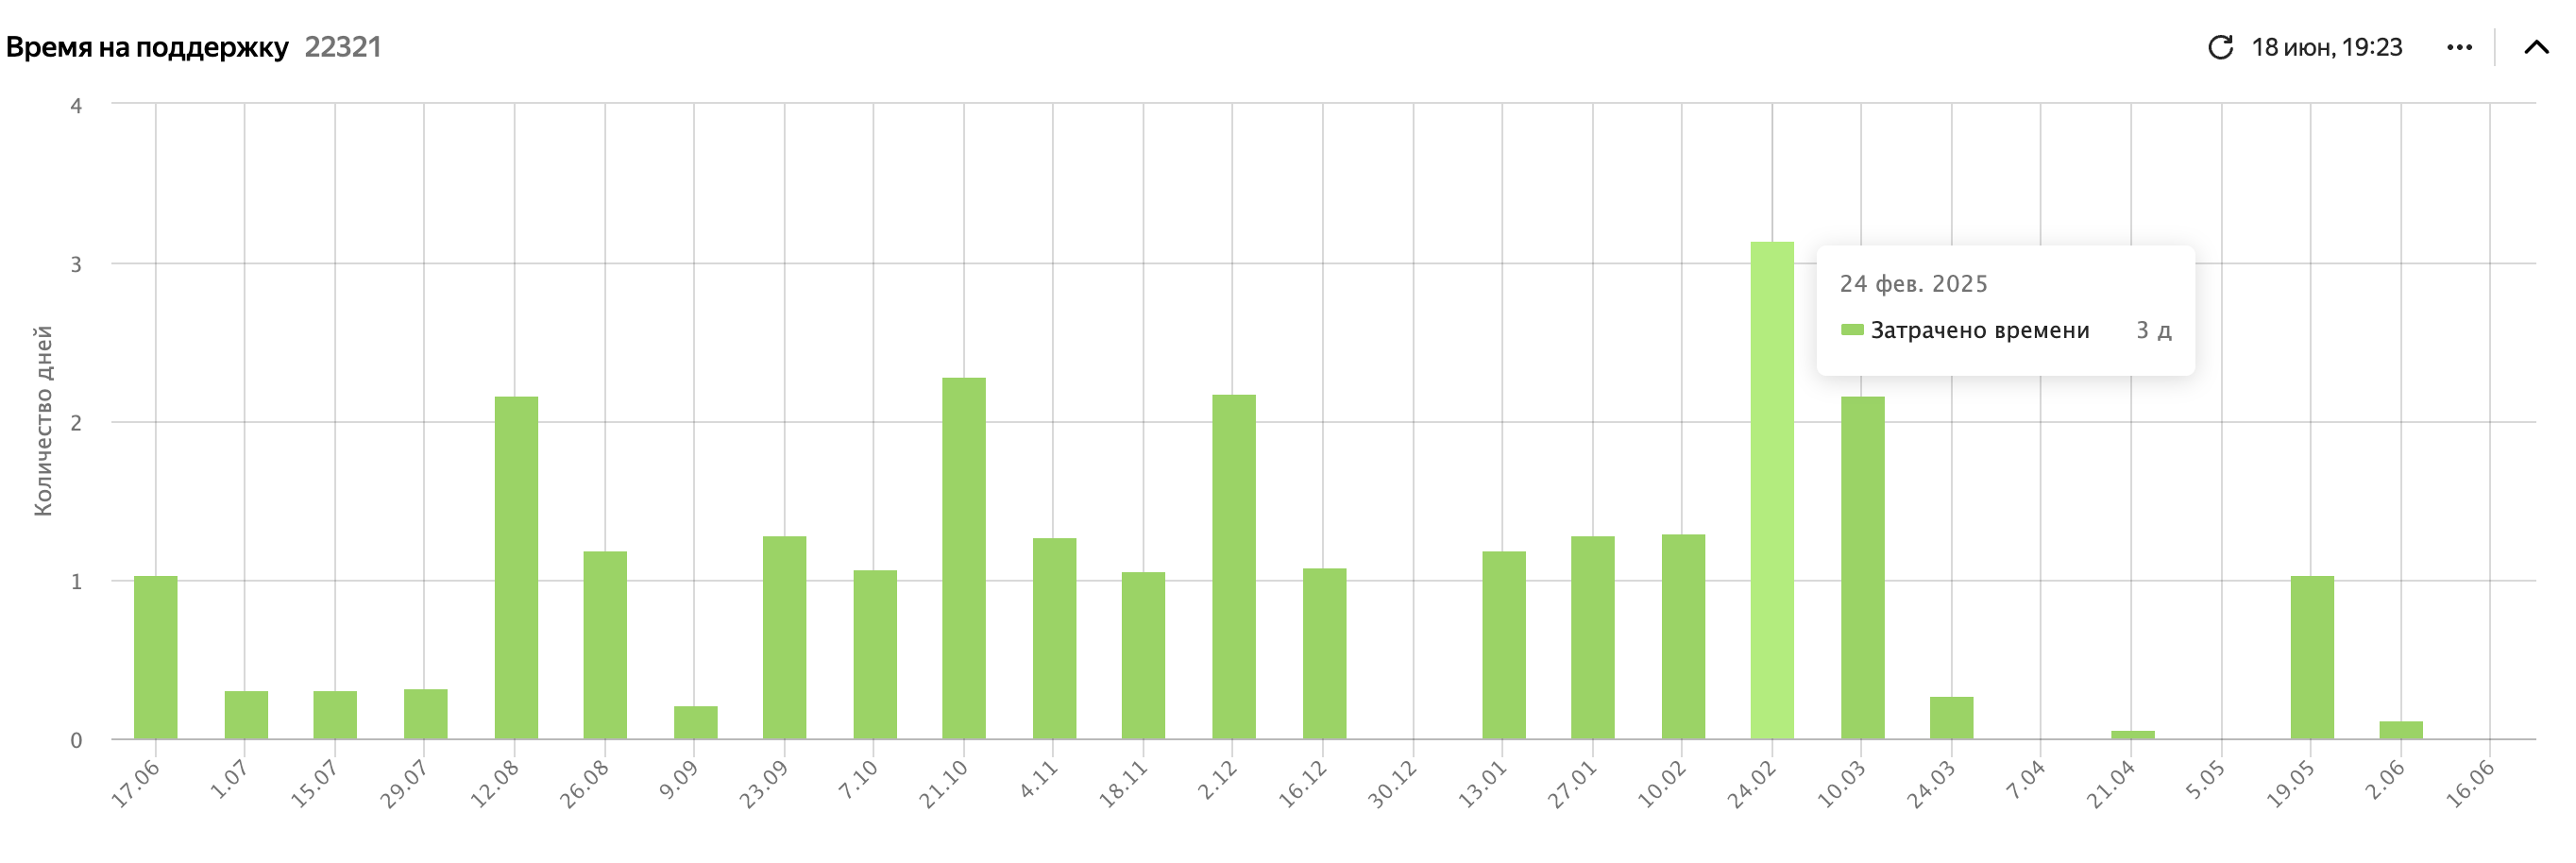
Time spent in status: Select one or more issue statuses and the team schedule. The chart column will show the total time the issues spent in any selected status. The total will be rounded to the nearest whole time unit.
-
-
Final statuses: Select one or more statuses that mark issues as completed when reached.
"Plan" column
To work with a sprint, you can add to the widget a second column — with performance targets:
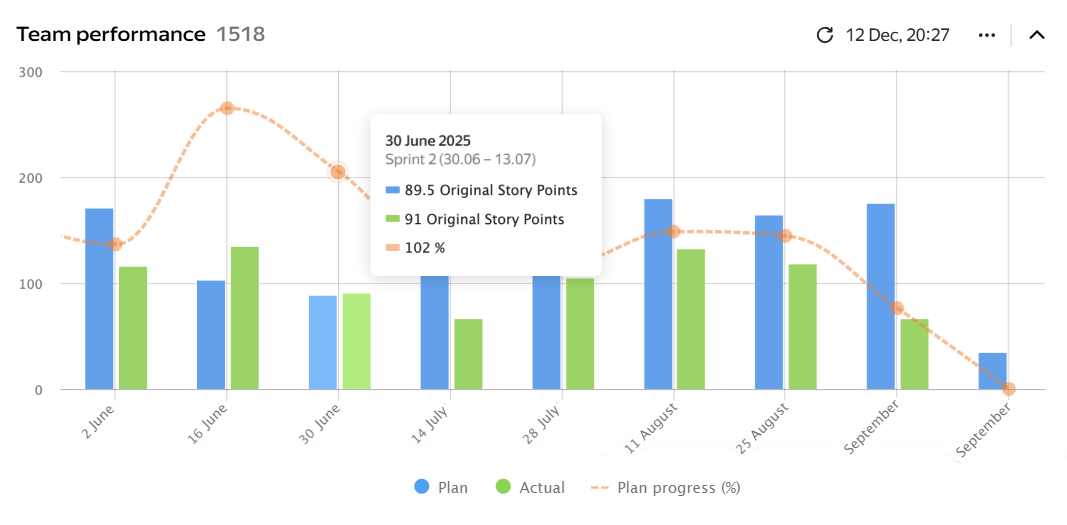
The Plan column refers to the sum of values for a selected field in uncompleted issues. For plan calculation, it's important to fill in the Sprint field in issues before the first sprint day ends.
The Actual column represents the sum of values for a selected field in the issues completed during the current sprint. Make sure that the issue completion date falls within the time period specified in the Sprint field value.
To add the Plan column to the widget:
-
In the widget settings, set the Time intervals parameter to Sprint.
-
Enable the Plan option. It will appear in the list after you add a sprint.
For example, you selected a nine-hour work schedule from 9:00 to 18:00. In this case, 12 hours will be rounded down and appear on the chart as "1 day".