What you can add to a dashboard
A dashboard is created empty. To fill it, use widgets. A widget is a card with text, a table, or a chart.
How to create a widget
At the top of the dashboard, click Edit → Add .
For detailed instructions on creating and populating a dashboard, see How to create a dashboard and add widgets.
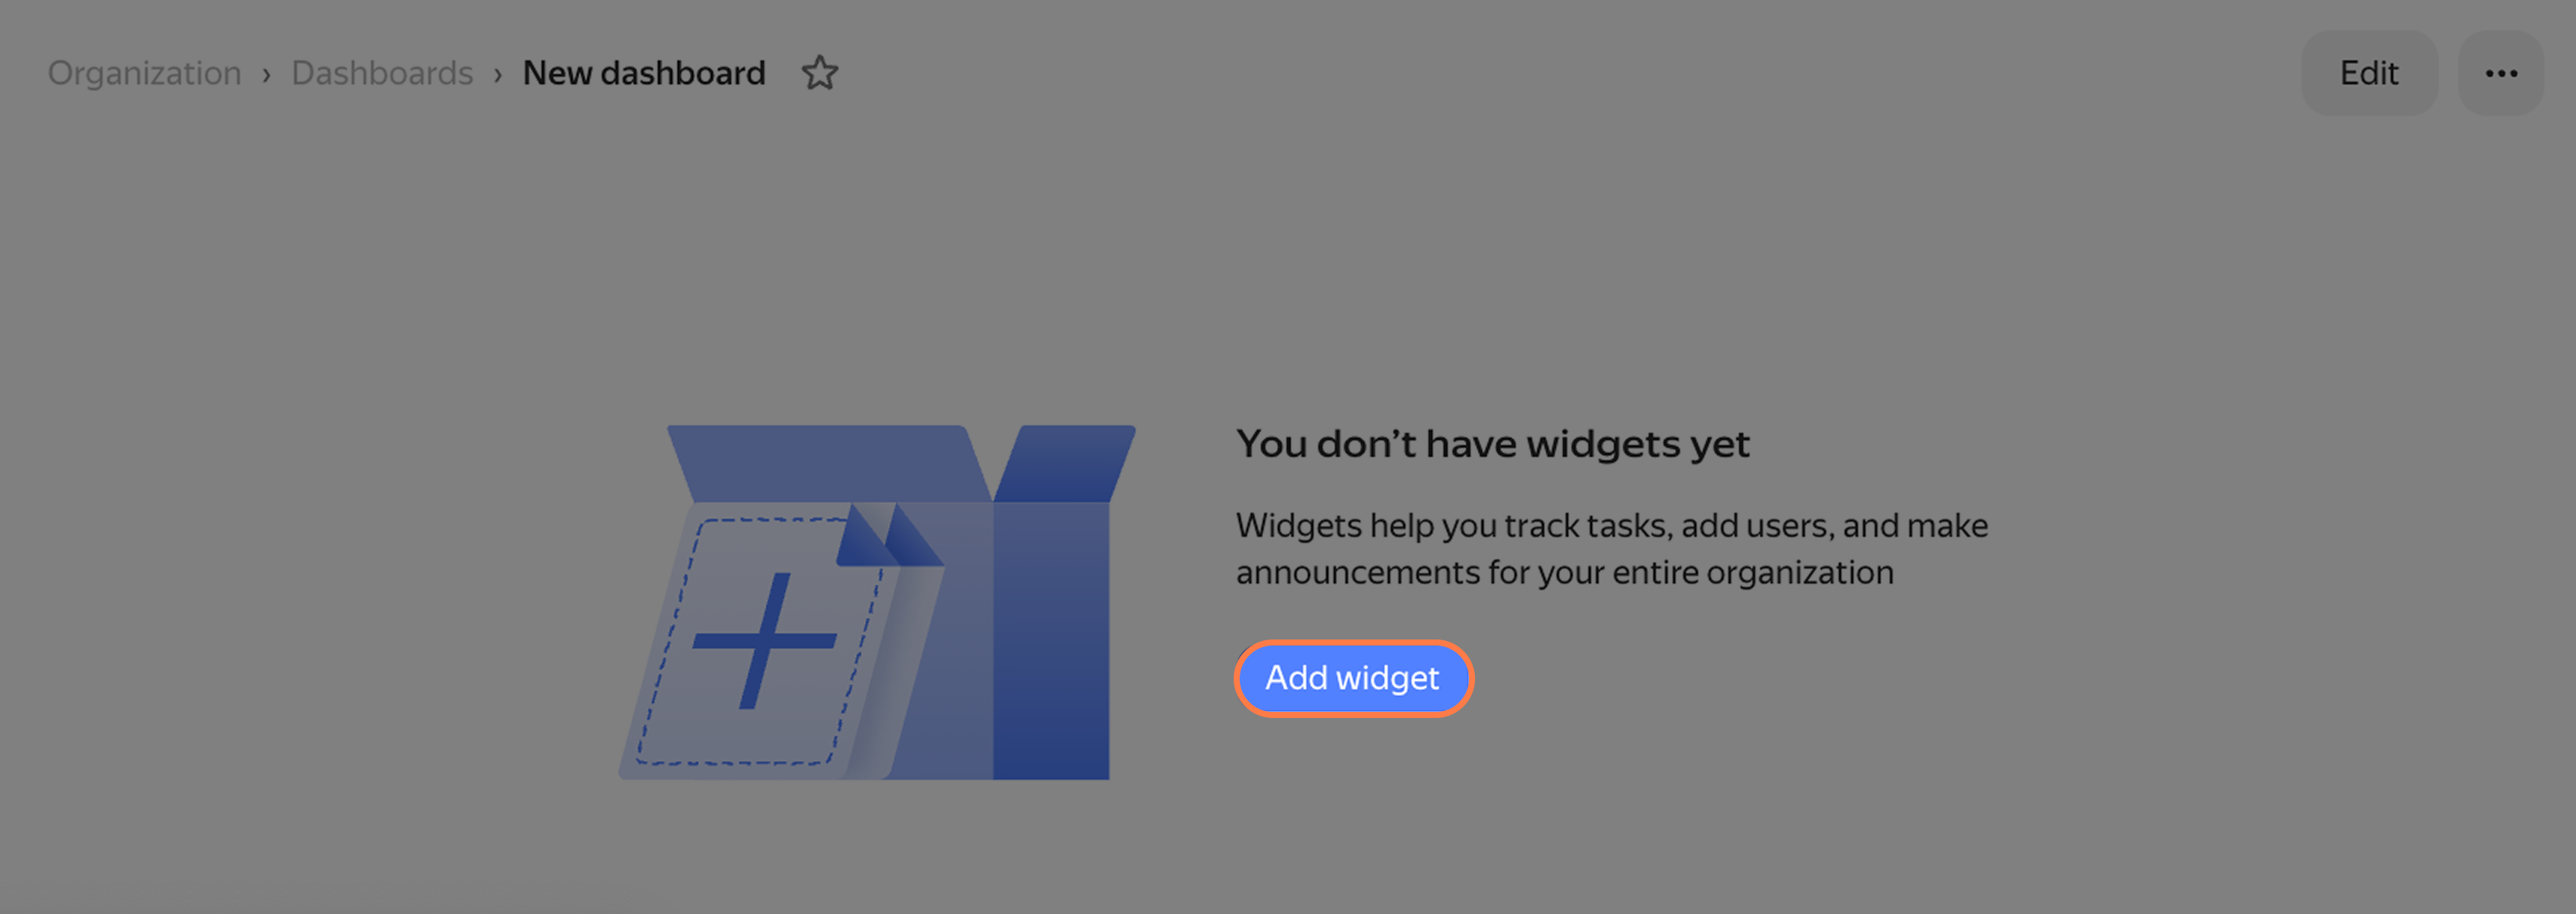
How to add a widget
How to configure a widget
When you select a widget, a menu with settings opens. The widget will only process issues that match your criteria—you need to specify them under Data source. Different widgets have different sets of options, so each widget has its own instructions.
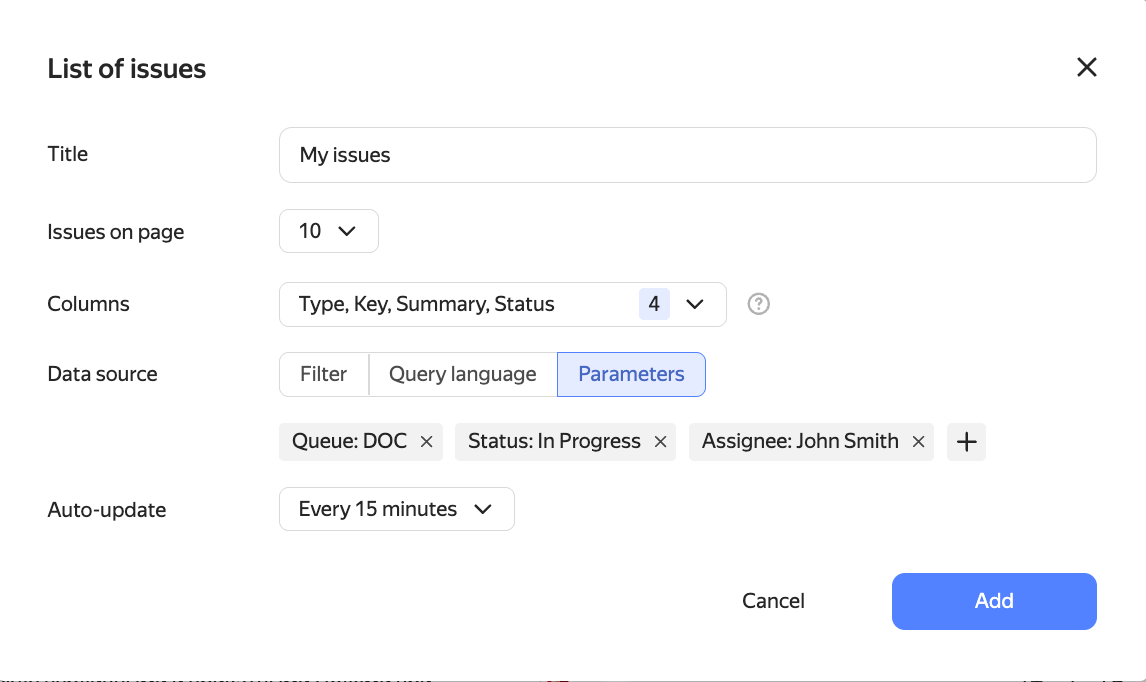
Example of widget settings
Which widget to choose
Tracker has several widget categories. The page for each widget explains how to use it and which settings to choose.
| Task | Widgets |
|---|---|
| Monitor lists of issues, goals, projects | Issues widget, The "Projects and portfolios" widget, The "Goals" widget |
| Analyze issues | Pivot table, Summary table with totals, Events chart widget, Issue statistics widget, Created/Resolved chart |
| Analyze team workload and performance | Cycle time widget, Flow widget, Team performance widget |
| Add explanations and useful links | Note widget, Widget "Information for employees", How to embed Yandex Calendar on a dashboard |
Was the article helpful?
Previous
Next