Wordstat
You must be logged in to use the Wordstat interface at https://wordstat.yandex.ru/.
Enter a word or phrase, and Wordstat will show you the stats on search queries containing this word or phrase, including all possible forms, the stats by region or top query lists.
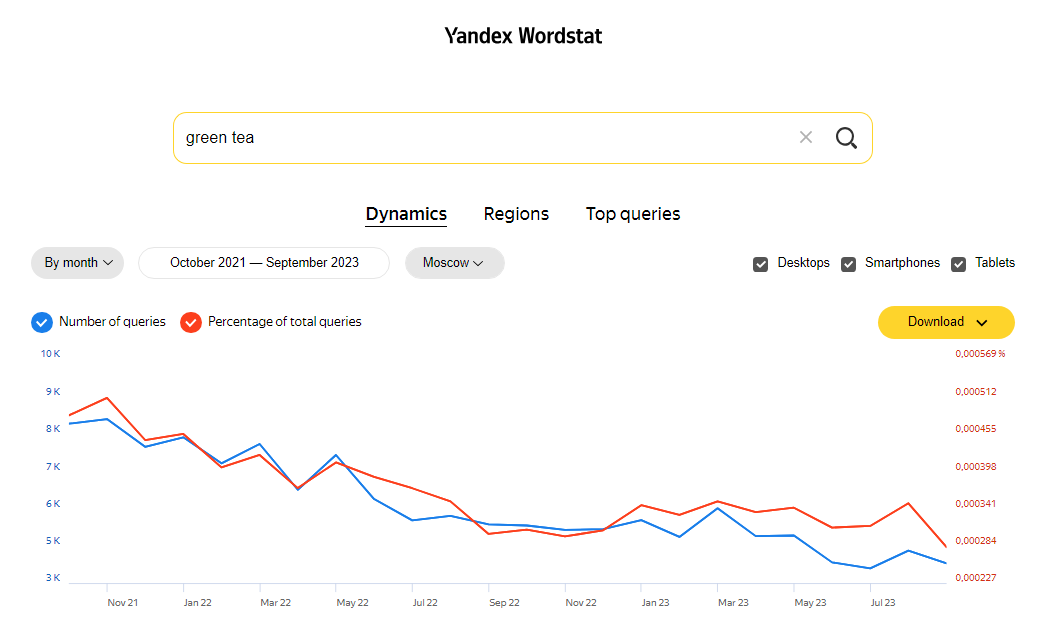
Dynamics
In the Dynamics tab you will by default see a chart and a table containing the data for the last 2 years displayed by month:
-
Number of queries, containing the given phrase.
-
Percentage of total queries to Yandex.
You can change the granularity of the report to daily or weekly; you can also select the desired period range in the date picker. A month here means a calendar month, a week means a period from Monday to Sunday.
In the monthly or weekly display, you can select a period range from three months or three weeks correspondingly up to five years. The earliest date available for use is January 2018. In the daily display the data is shown for the last 60 days.
You can filter the data:
-
By region.
-
By device type (Desktops, Smartphones, Tablets).
How to zoom in on the chart
To zoom in on the chart press and hold the left mouse button and select a zone on the chart. To zoom back out, click on the button in the upper right corner of the chart.
You can download the data in a CSV file — to do so, click Download.
Regions
In the Regions tab, you can see the query stats distribution by world regions for the last 30 days. You can select granularity on the upper left to choose between all, regions or cities. The data is displayed as a table with the following fields:
-
Number of queries — total number of queries containing the given phrase in the given region.
-
Percentage of total queries, % — a percentage of queries containing the given phrase from the total number of queries to Yandex in the given region.
-
Interest index, % (affinity index) — the ratio between the share of the selected queries in a region or city and their share in all queries to Yandex. If the index is 100%, it means that the level of interest in a query topic in a region or city does not stand out, while an over 100% index means that the interest level there is higher than the average.
You can filter the results by device type (Desktops, Smartphones, Tablets).
You can download the data in a CSV file — to do so, click Download.
Top queries
In the Top queries tab you can find the data on the most popular queries containing the given phrase for the last month as well as on the queries similar to the given.
You can select the region of the query or filter the data by device type (Desktops, Smartphones, Tablets).
You can download the data in a CSV file — to do so, click Download.