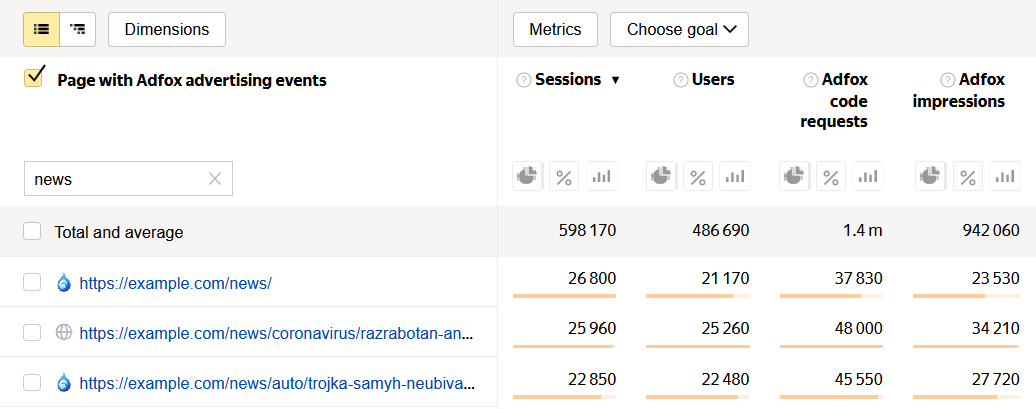
“Adfox, pages with advertising events” report
To view the report: .
Ways to use this report
- Select the list view in the report.
- Enter an attribute from the URL in the search bar. For example, news, to create a report with news.
- Sort “Total Adfox revenue” data in descending order: the pages that bring the most revenue will be displayed at the top of the list.
- On the chart, indicate the date when a new ad block was installed. To do this, click any point on the chart and add a note.
- After a while, when statistics accumulate, you can evaluate the effect of the new block. To do this, add the Page depth metric to the report.
- Compare engagement metrics (page depth and bounce rates) and revenue before and after installing a new block. For example, a month before and a month after adding a new block. Select the desired period in the calendar.
You can identify the most lucrative articles, categories, content groups with a common tag, or content from a specific author if the necessary attributes are specified in the URL. For example, example.com/news/.

When there are few ad blocks, the site may receive less revenue. But when there are too many ads, audience engagement and the number of pages viewed decrease, resulting in fewer ad views and less site revenue.
To determine the optimal number of ad blocks, you need to track how changing the number of ads affects engagement and revenue.
Conditions for getting the report
To view the report, enable the display of Adfox reports and specify the Yandex Metrica tag in Adfox.
By default, access to viewing reports in the “Monetization” group is restricted. You can manage access rights.
Report structure and settings
The report shows site statistics with depth up to the page where a user clicked an ad.
- Adfox code requests — Requests for Adfox code from pages that received a response from the Adfox server (default banners and default uploads).
- Adfox impressions — An ad impression registered by the system.
- Rendering per Adfox view — Average number of Adfox banners that were loaded (including YAN) per page view.
- Adfox total revenue — Estimated total revenue from ad impressions.
- Adfox CPMV (Cost per mille viewable ads) — Estimated cost of 1000 impressions. In rubles without VAT.
- Adfox estimated session revenue — Average estimated revenue per session.
The report supports all settings available in Yandex Metrica.