Setting up and viewing a report
Reports contain statistical information about a site and are divided into standard reports (offered by the service) and custom reports.
The Yandex Metrica report is a report constructor. In other words, you can configure it: add or remove dimensions and metrics or add goals and segments. The report is based on a set of dimensions. The dimension at the top of the list determines the content of the report. If you change the set of dimensions or their order, the content of the report changes, although the name remains the same.
For example, by default the Yandex Direct, summary report is based on dimensions associated with Yandex Direct (such as Yandex Direct campaigns). If you add the Session date dimension and place it at the top of the list, the report is rebuilt to display statistics for all sources of sessions on the site.
Setting up a report
You can use the tools described below to set up a report type:
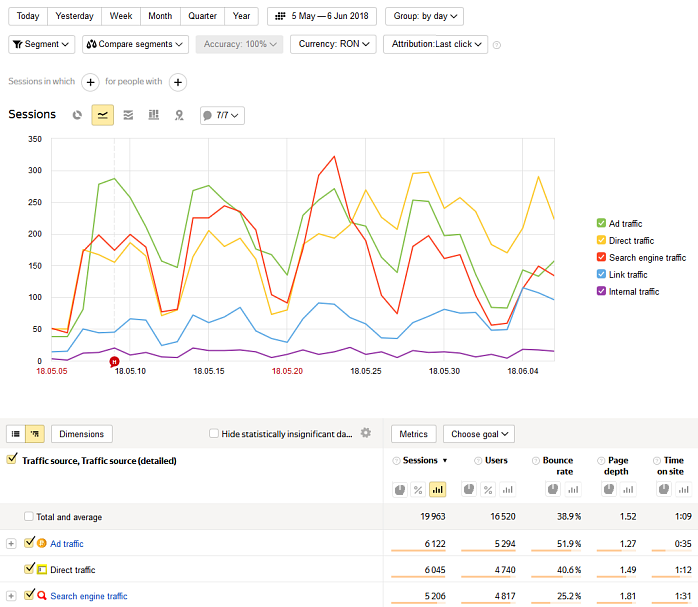
- 1. Types of graphs
-
By default, data is shown as lines. This is a visual representation of the dynamics of metrics. You can use a more appropriate type of graph for a chosen report:
- Lines — Shows changes to the absolute values of measured variables over time.
- Pie chart — Shows the distribution of variables by groups.
- Areas — Shows the dynamics of variables (their values are totaled). Here you can see the total number of sessions over time for each variable given in the key.
- Columns — Shows the change in the ratio of variables over time.
- 2. Segmentation
-
You can use segmentation to make reports on sessions that meet certain conditions. For example, you can take the Sources, Summary report data and get traffic only from tablet users. For more information, see Data segmentation.
- 3. Data accuracy
-
If generating a report requires a large amount of data, collecting this information might take a long time. In order to generate the report faster, the service can use just part of the data (for example, 10%). To change this amount, go to the report page in the Yandex Metrica interface, click Accuracy, and move the slider to the desired area — Faster or More precisely. Learn more in the Sampling section.
When you switch to a different report, this setting is saved. Information about this appears at the bottom of the screen. You can leave it, or reset it.
- 4. Report period
-
You can select a calendar time period to build the report for. By default, one month is selected. You can also set a range of dates by clicking
 .
. - 5. Data broken down by time
-
The “Line” and “Area” graphs display data broken down over time periods. The default setting is auto. This sets a range based on the selected time period and the amount of data that is sufficient for this period. You can refine the time period to minutes, hours, days, weeks and months.
- 6. Attribution models
-
These help you correctly determine the source of the user's transition to the site in order to calculate the conversion for the created goal. Learn more in the Attribution models section.
- 7. Displaying data in a table
-
All indicators are grouped according to certain characteristics (dimensions: by operating system, its version, and so on). These characteristics are shown in a list on the left:
List view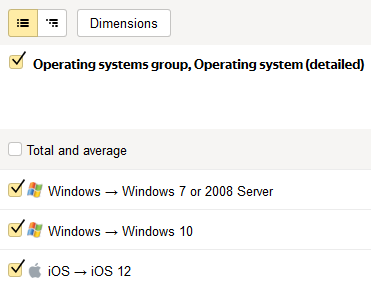
Search is available in this mode. When you use search, the report will only contain the values of dimensions (rows) that match what you entered in the search box. For example, in the Entry pages report, you can view data for a specific page by typing part of its URL in the search box.
 Tree view (gradually reveals the structure)
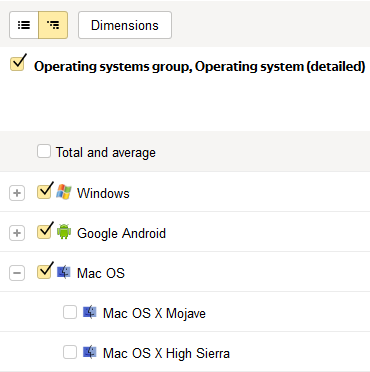
- 8. Dimensions and metrics
-
Each report contains metrics grouped into dimensions. For more information, see Obtaining and displaying data. Metrics.
To form a report, click Dimensions or Metrics. In the window that opens, select the parameters to base the report on. They will be displayed in the right half of the window.
When you select a dimension, the
 icon appears next to it. This indicates that at least one of the dimensions from this block is used in the report.Restriction. A report can have a maximum of 7 dimensions and 10 metrics.
 - 9. Notes on a chart
- Notes help you track important events and see how they are related to changes in site statistics. You can create your own notes or use the Yandex Metrica preset notes. The preset notes include:
Icon in the interface Group Description 
Holidays Federal holidays are shown if Yandex Metrica identified the region for the tag.
Sometimes traffic fluctuates over long holidays. For instance, traffic to travel sites increases before extended holidays.
Icon in the interface Group Description 
Holidays Federal holidays are shown if Yandex Metrica identified the region for the tag.
Sometimes traffic fluctuates over long holidays. For instance, traffic to travel sites increases before extended holidays.
For details, see Notes on graphs.
- 10. Data accuracy
-
Metrica provides many numbers on all the possible aspects of how your site works, and all these numbers are accurate in terms of how they are calculated. But from the point of view of analyzing site performance, this is not always the case: for example, if one visitor came to the site and looked at pages for 20 minutes, it is technically true that the average duration of a session on the site is 20 minutes. However, common sense tells us otherwise: we can't make conclusions about a site based on a single session.
The service allows you to hide report rows that contain this type of incorrect information. Learn more in the Statistical accuracy of data section.
- 11. Selecting a goal
-
When you select a previously created goal from the list, report data is updated to reflect this goal. The goals in the list are separated by their purpose: conversion and retargeting. Learn more in the section What are goals? Types of goals.
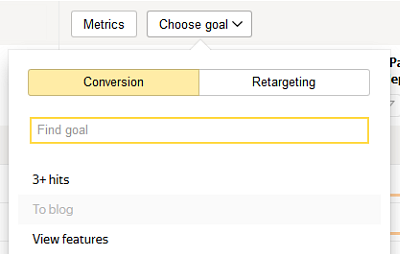
- 12. Refining numeric metrics
-
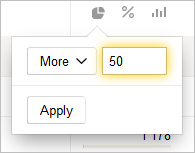
Yandex Metrica lets you set a numeric restriction for showing statistics. For example, to show information on bounces with a value higher than 50%. To filter the values, click
 . In this case, the report will show only the rows (dimension) that have metric values matching the condition you set.
- 13. Showing data on a graph
-
By default, the graph shows values of the metric that data was sorted by. To show a graph for any other variable that is available in the report, click the
 icon. The graph will be updated.
 - 14. Sorting data by metric
-
By default, report data is sorted by the first metric (for example, by sessions). To change the sorting, click the metric that is more important to you.
- 15. Hiding a graph
-
You can disable the display of data on a graph. When you switch to a different report, this setting is saved.
- 16. Currency
-
The currency is displayed if the report contains information about money, for example, E-commerce revenue or advertising expenses. The currency is also displayed if you pass Revenue by goal.
The list shows the currencies of data sent to Yandex Metrica. When you select a currency, the values of the revenue and expense metrics are recalculated according to the conversion rate preceding the date of the transaction.
Currency conversions use the exchange rate provided by more than 15 sources, including the European Central Bank. Conversion to EUR and RUB currencies is relative to USD.
- 17. Tracking the share of robot sessions in traffic
-
Yandex Metrica detects robots that visit your site. Filtering robots helps you get accurate data. For example, bounce rate, time on site, and page depth. By default, reports show data without robot sessions.
The Percentage of robots: With robots segment is enabled in this case. If you remove it, the data is recalculated to include robot sessions.
To see the share of robots, use the Percentage of robots metric. To add it, in the report Data settings, select with robots. After that, the Percentage of robots metric in reports option will be enabled and the metric will appear in the data table.
Creating a report
- Select the menu item and click
 . By default, the new report will have the report type Sources, summary.
 - Make necessary changes. We recommend making custom reports by editing standard reports.
Save the report:
- With the previous name – click Save the report.
- With a new name – click
 and select Save as.
Then enter the report name in the window that opens.
After saving, the report becomes available on the My reports page.
Actions with reports
- Saving a report
-
You can use the saved report for all Yandex Metrica tags that you have access to. However, some of the report settings may not be applied. For example, a goal set in the report is ignored if it's not linked to the current tag in the settings.
The report is visible only to the username that saved it. Other users with access to the tag do not see changes in the report.
- Export a report to a convenient format
-
To export the report results to PDF, XLSX, or CSV format, click the
 button. The first 100,000 lines of the report are put in a file of the selected format.
 - Rename a report
-
To rename a saved report, click
 and select Rename. Then, in the window that appears, enter a new name for the report and click Save report.
 - Delete a report
-
To delete a saved report, click
 and select Delete. You can't restore a deleted report.
Depersonalize statistics
Yandex Metrica protects users' privacy and ensures that all collected information is depersonalized. This is why some data is not fully disclosed. This includes data that is calculated by Yandex algorithms, for example, socio-demographic data (gender, age), login page addresses, search phrases, and information about robots. Such information is provided only if there are more than 10 users in the sample.
For example, suppose you want to find out what percentage of users one day were male. At the time of generating the report, the site had been visited by five people (less than 10). In this case, the report will contain information about the total number of users for the day, but data will not be available for the number of males.
The privacy rule applies to dimensions, metrics, conditions when using segmentation, and other settings. When a report or widget with this kind of information is viewed, Yandex Metrica displays a message about disabling data granularity for sessions and users.